Written collaboratively by Jamie Brennan, Krista Ehlert, Josh Leffler, Hossein Moradi and Sandy Smart.
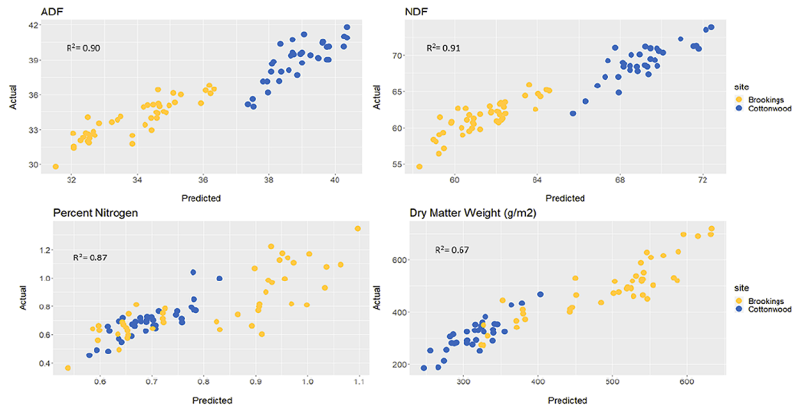
A group of scientists from SDSU are starting a new precision agriculture range project using remote sensing, machine learning, ground-collected vegetation samples, and web app development to build a user-friendly phone or computer website application to measure forage quality and quantity in near real-time. In addition, the project will have the ability to make predictions using forecasted climate data for drought preparation. The scientists include Doctors Jamie Brennan (project leader), Krista Ehlert, Josh Leffler, Hossein Moradi and Sandy Smart. Our team has collected preliminary data from the SDSU Cottonwood Field Station near Philip and at the SDSU Cow-Calf Unit in Brookings (Figure 1). Hand clipped samples were collected every two weeks in the summer of 2020 at both sites. According to our modeling efforts, we were able to verify that we could estimate forage quality (Acid Detergent Fiber, ADF; Neutral Detergent Fiber, NDF; Crude protein, CP) and forage quantity (Dry Matter Weight) quite effectively (predicted vs actual in each graph in Figure 1).
Data Collection Hubs
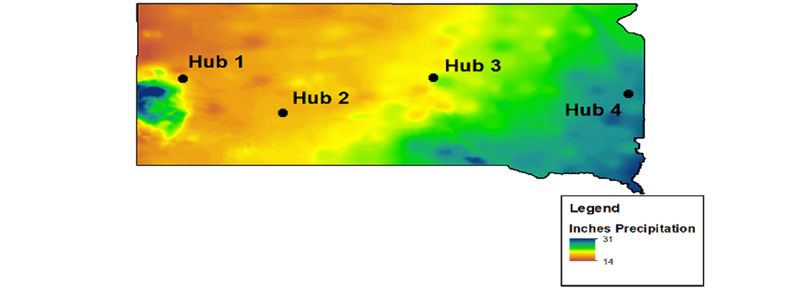
The next step is to expand our data collection efforts across South Dakota. We chose four intensive data collection sites (hubs) and will collect hand-clipped samples every two weeks during the growing season from five areas and two different plant community types. Around each hub we would like to find two additional ranches for a total of eight “satellite” ranches to help expand our model prediction efforts by feeding real ground-truth data once a month during the growing season (see Figure 2). All sites exist along the gradient from over 600 mm (23.6 inches) to fewer than 400 mm (15.7 inches) of annual precipitation from east to west in South Dakota.
Custom Prediction Models
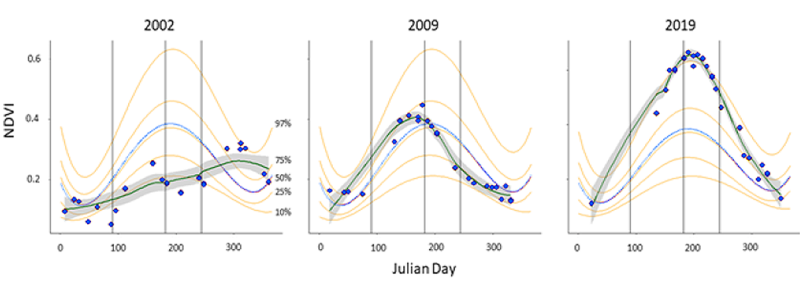
The uniqueness of our approach is that we intend to develop customized prediction models based on individual rancher-derived data for that specific rancher – instead of relying on a universal model with data that may not adequately represent your location. In addition, we are very fortunate to have long-term data to help us develop growing season forage quantity predictions. Figure 3 shows the greenness index (NDVI) for three very different years (drought, average, and wet). Note that NDVI in 2002 started out with a flatter path compared with 2009 and 2019. This kind of graph allows us to make predictions of forage quantity depending on the steepness of the NDVI curve.
The research and Extension team is excited about the impact that this tool will have when fully developed and tested. Please reach out to Krista Ehlert, SDSU Extension Range Specialist, krista.ehlert@sdstate.edu, if you are interested in becoming a satellite ranch.