Written collaboratively by Tong Wang and Oranuch Wongpiyabovorn.
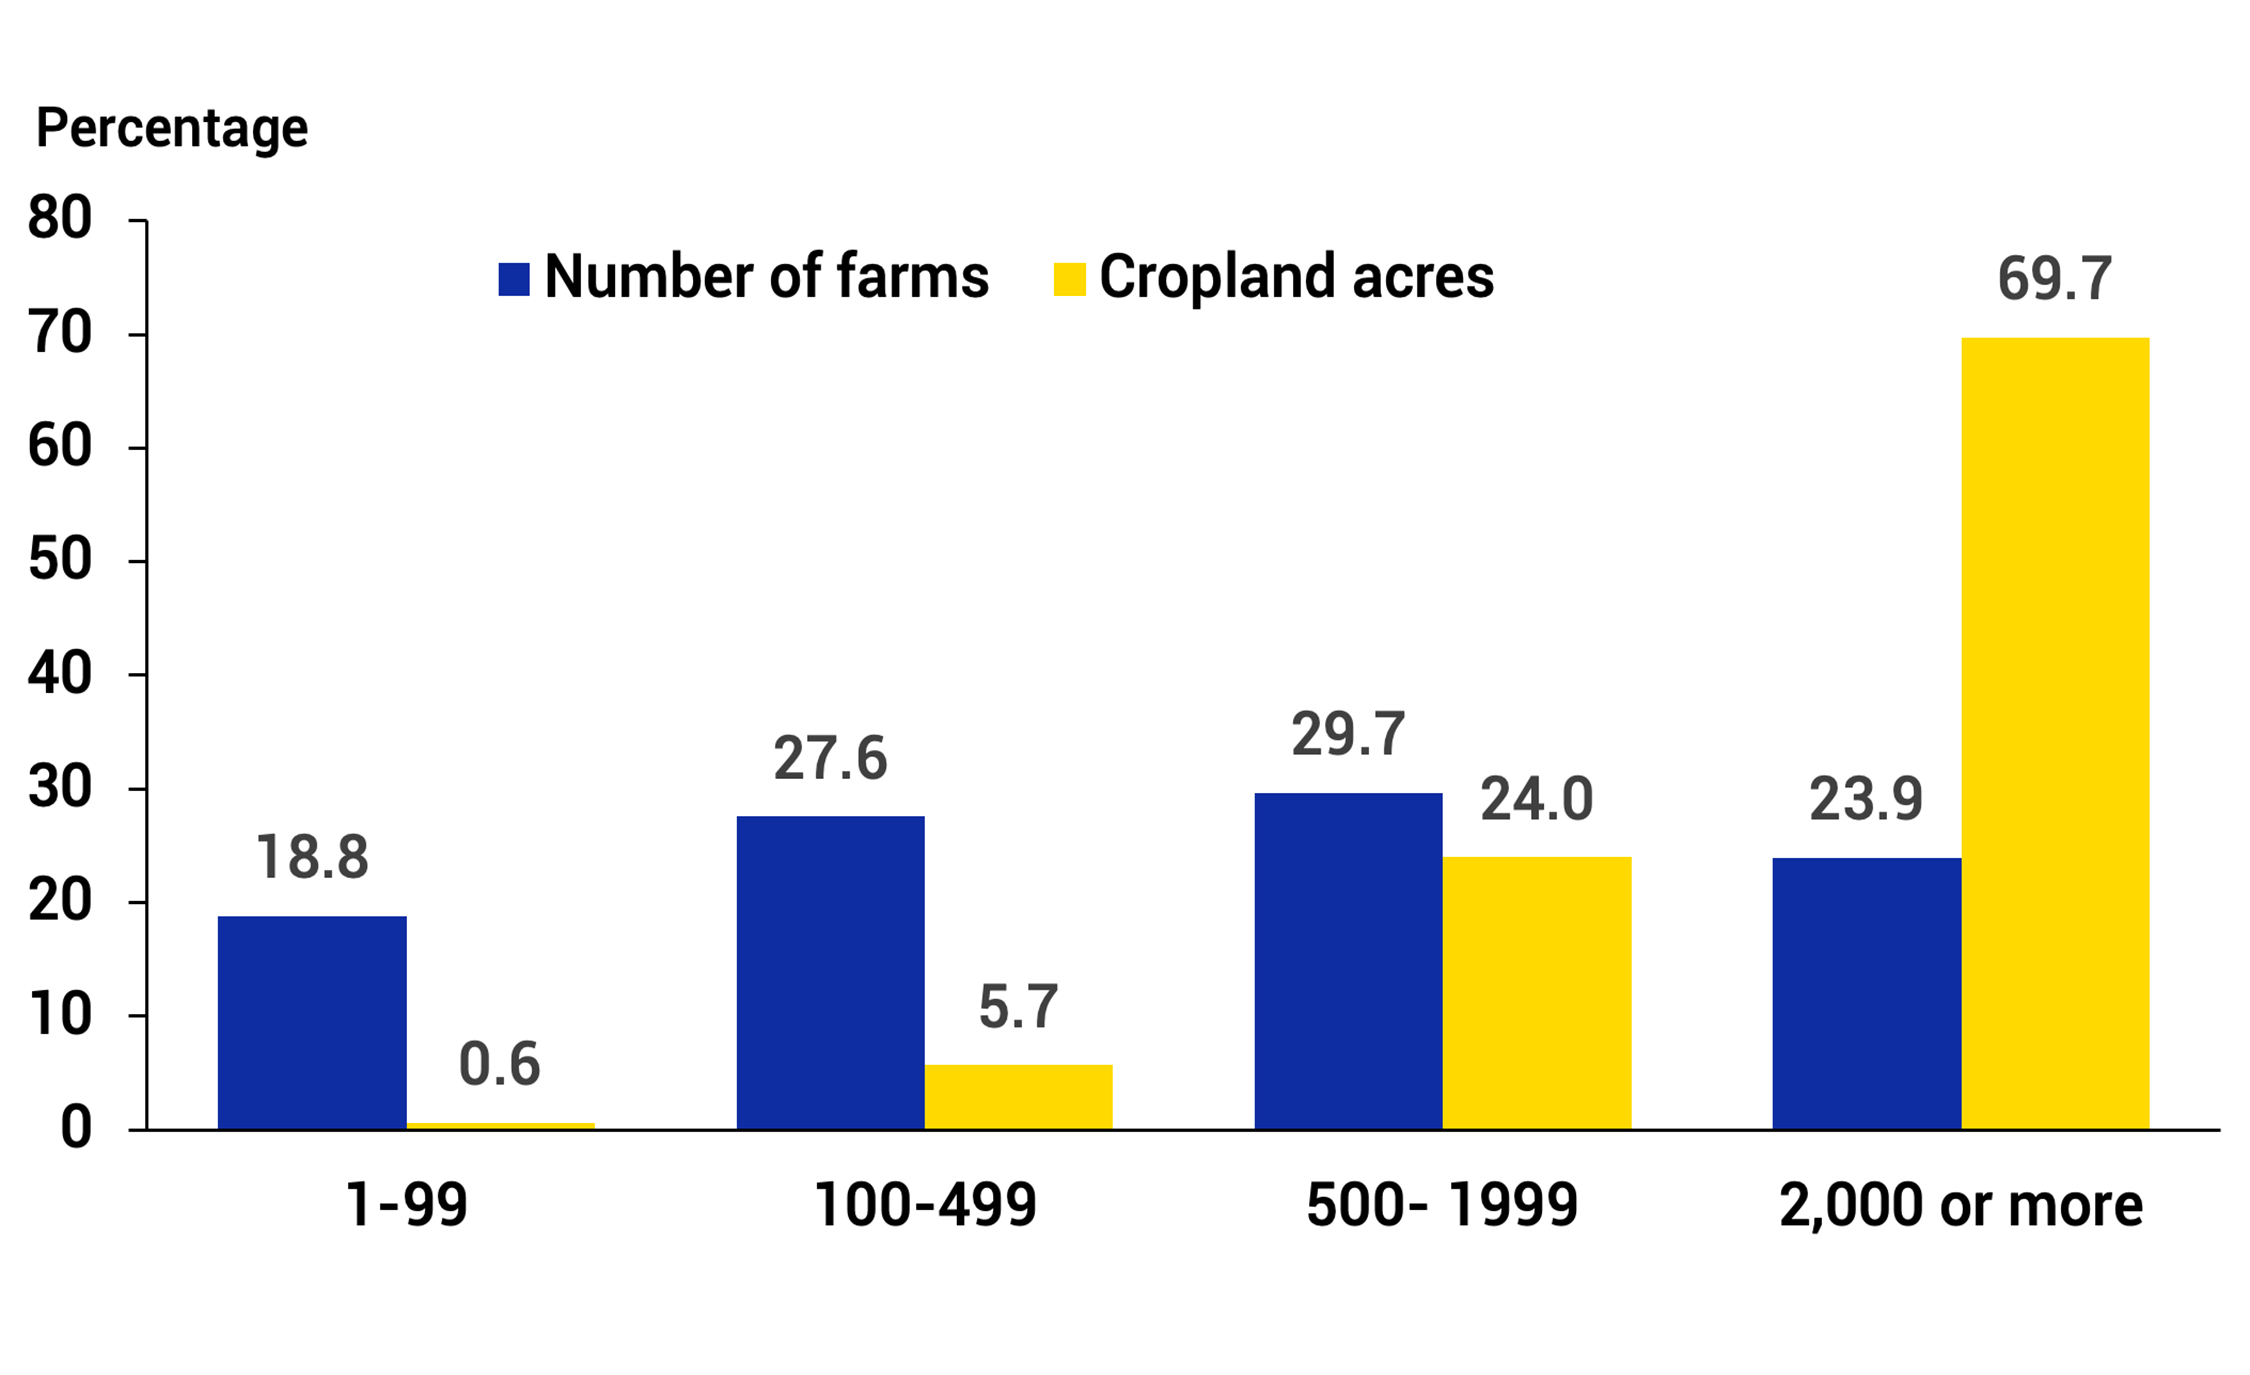
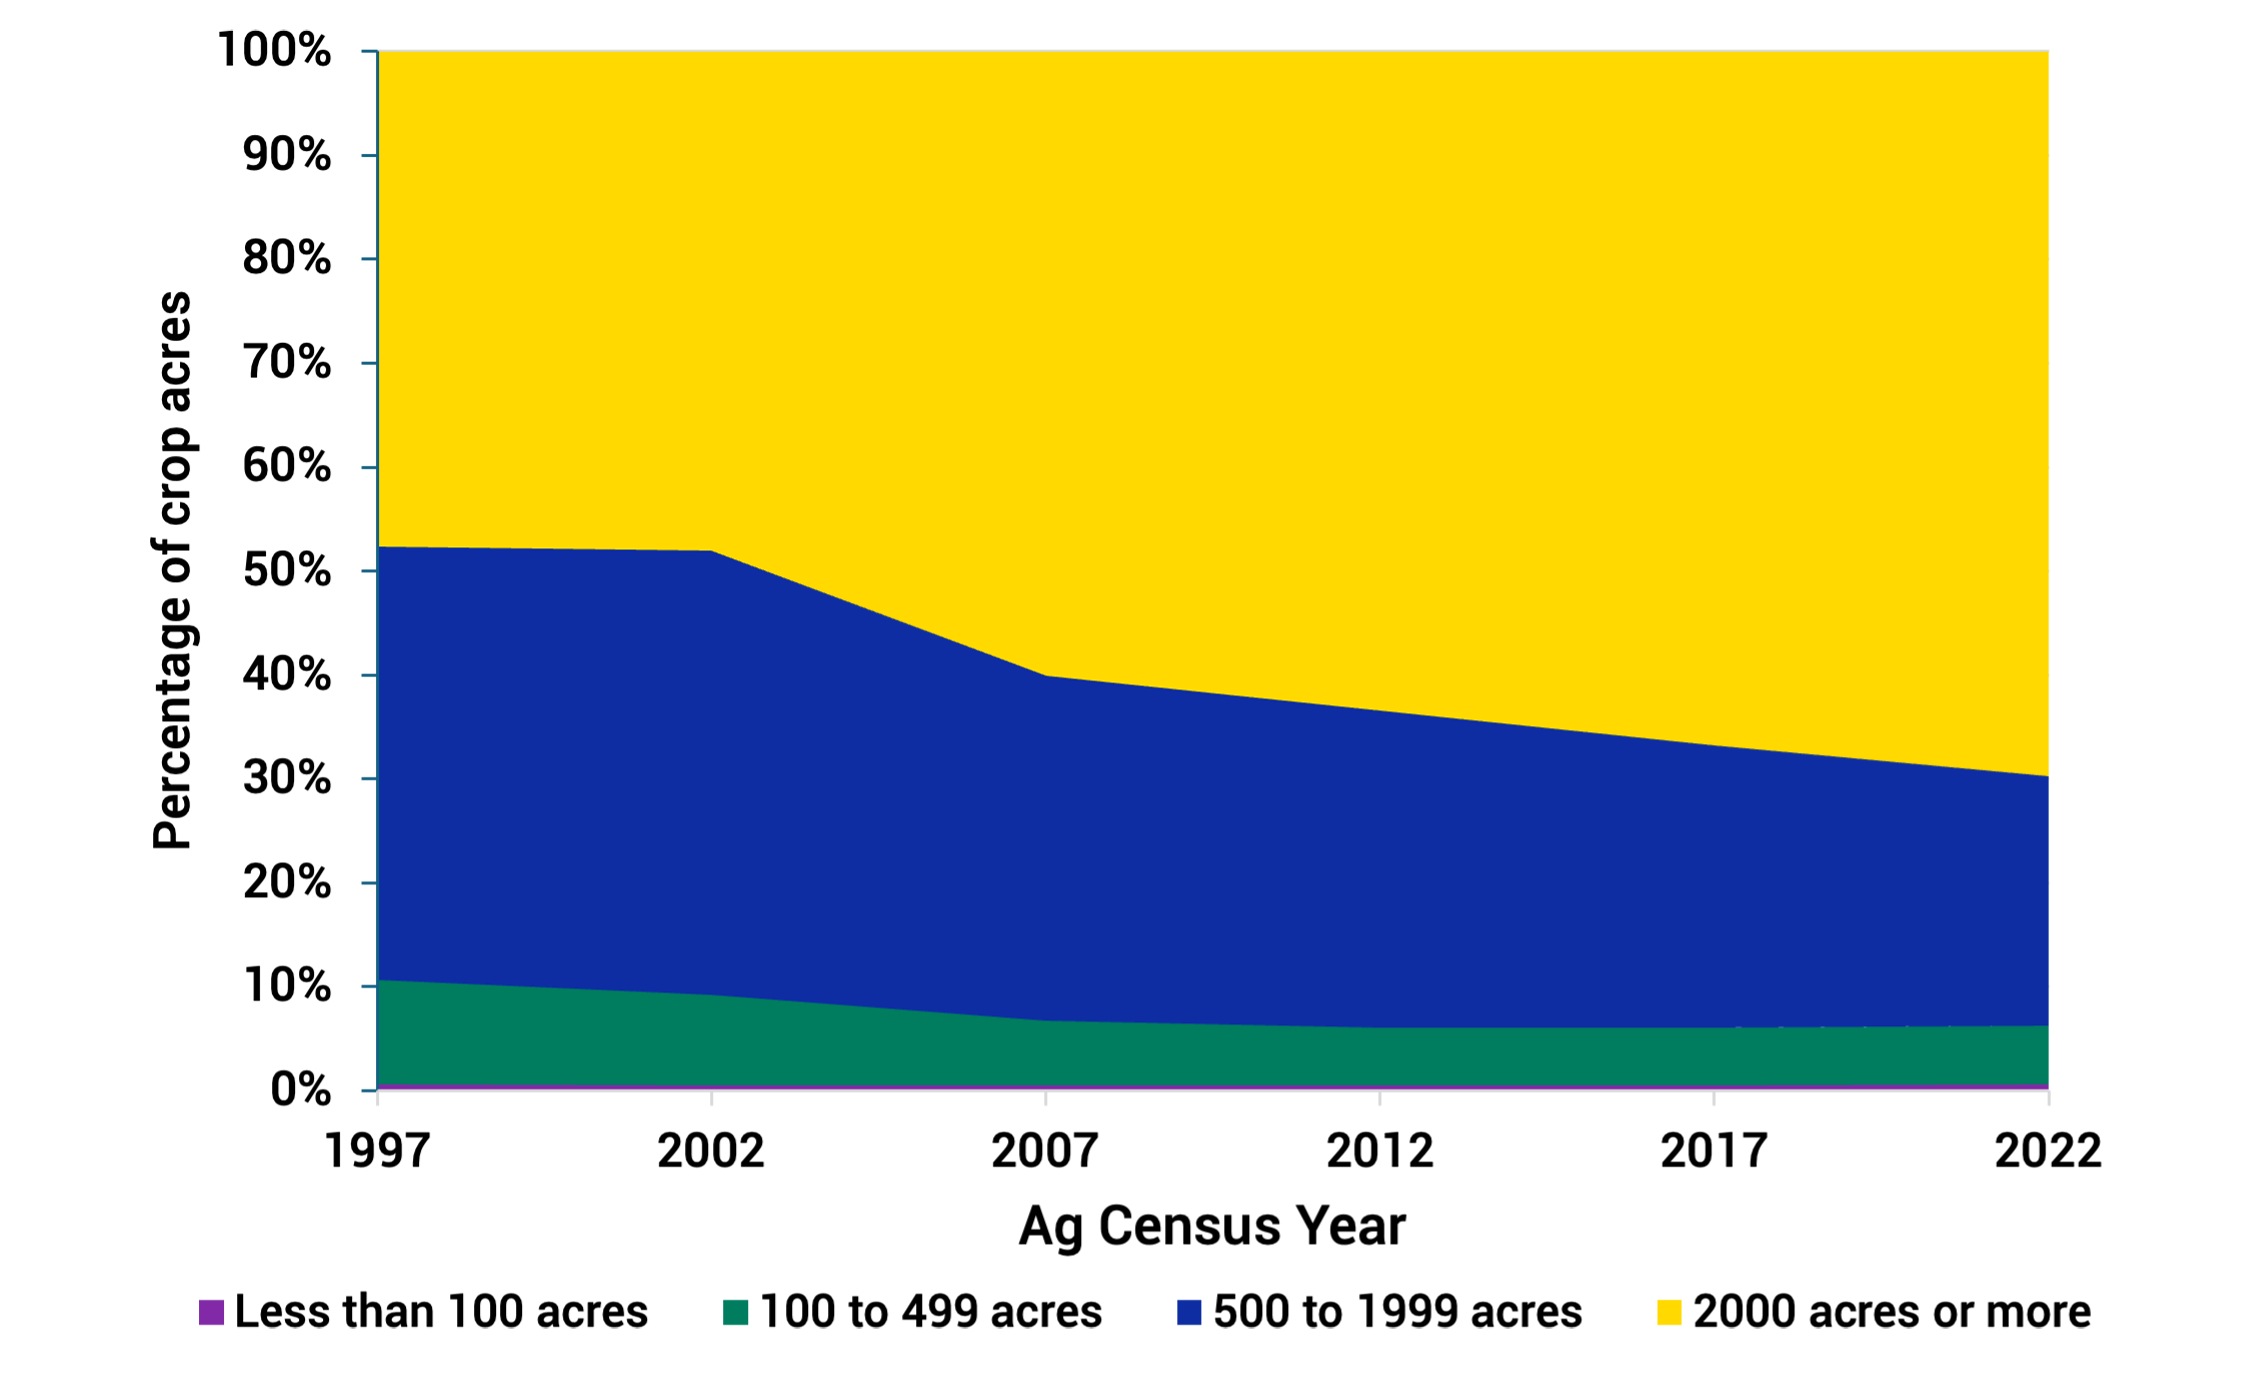
Based on 2022 U.S. Census of Agriculture (USDA, 2022), large-scale farms (2,000 acres or more) operate more than two-thirds of the total cropland acres in South Dakota (abbreviated as SD) (Figure 1). During 1997-2022, the share of acres operated by large-scale farms has increased steadily from less than 50% to nearly 70%, accompanied with a continuous decline in the share of crop acres operated by medium-scale farms (100-499 and 500-1999 acres) (Figure 2).
Like many farming decisions, the choice of farm size is often driven by economic considerations. Larger-scale farms can gain higher profit margins due to economies of scale. Labor-saving innovations further expedited the increase of farm acres (MacDonald et al., 2013). Consequently, the majority of cropland became dominated by a small share of farms. As large-scale farms operate an increasing share of cropland, they also play a crucial role in enhancing the soil health and ecosystem functions of cropland in South Dakota.
Number of Operations
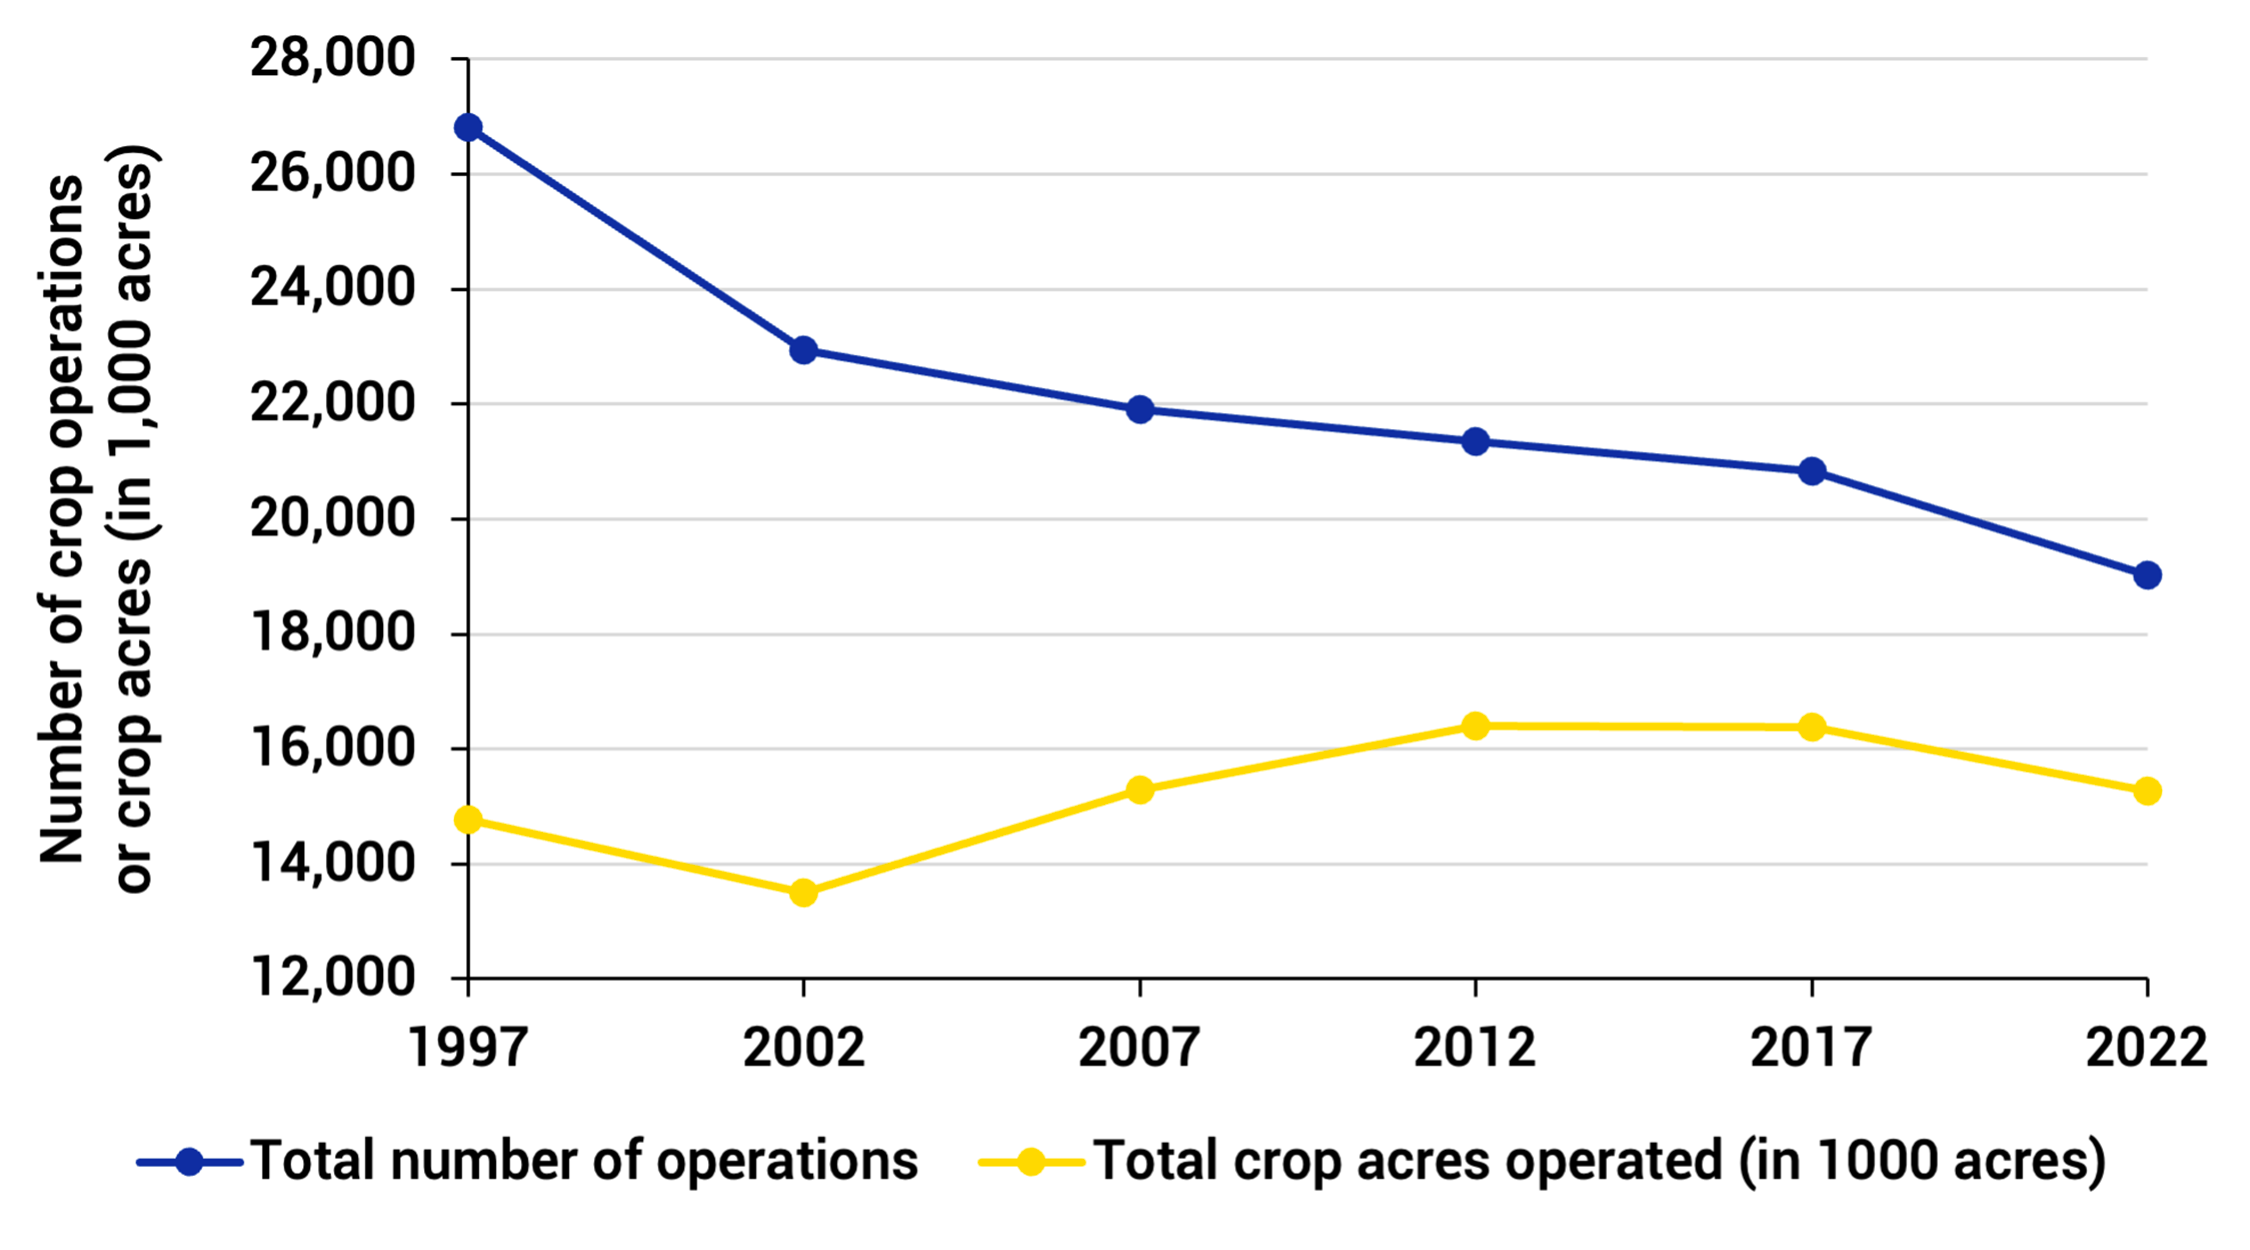
Accompanied with more crop acres operated by large farms, the number of farm operations has declined considerably over the years. During 1997-2022, the total number of farm operations in SD has declined by nearly 30%, from 26,808 in 1997 to 19,302 in 2022 (Figure 3).
A closer examination of farm number changes by farm size indicated that the drop in farm numbers in recent years is mainly due to the decline in the number of medium-scale farms over time. During 1997-2022, the number of medium-scale farms in South Dakota has continuously declined (Figure 4).
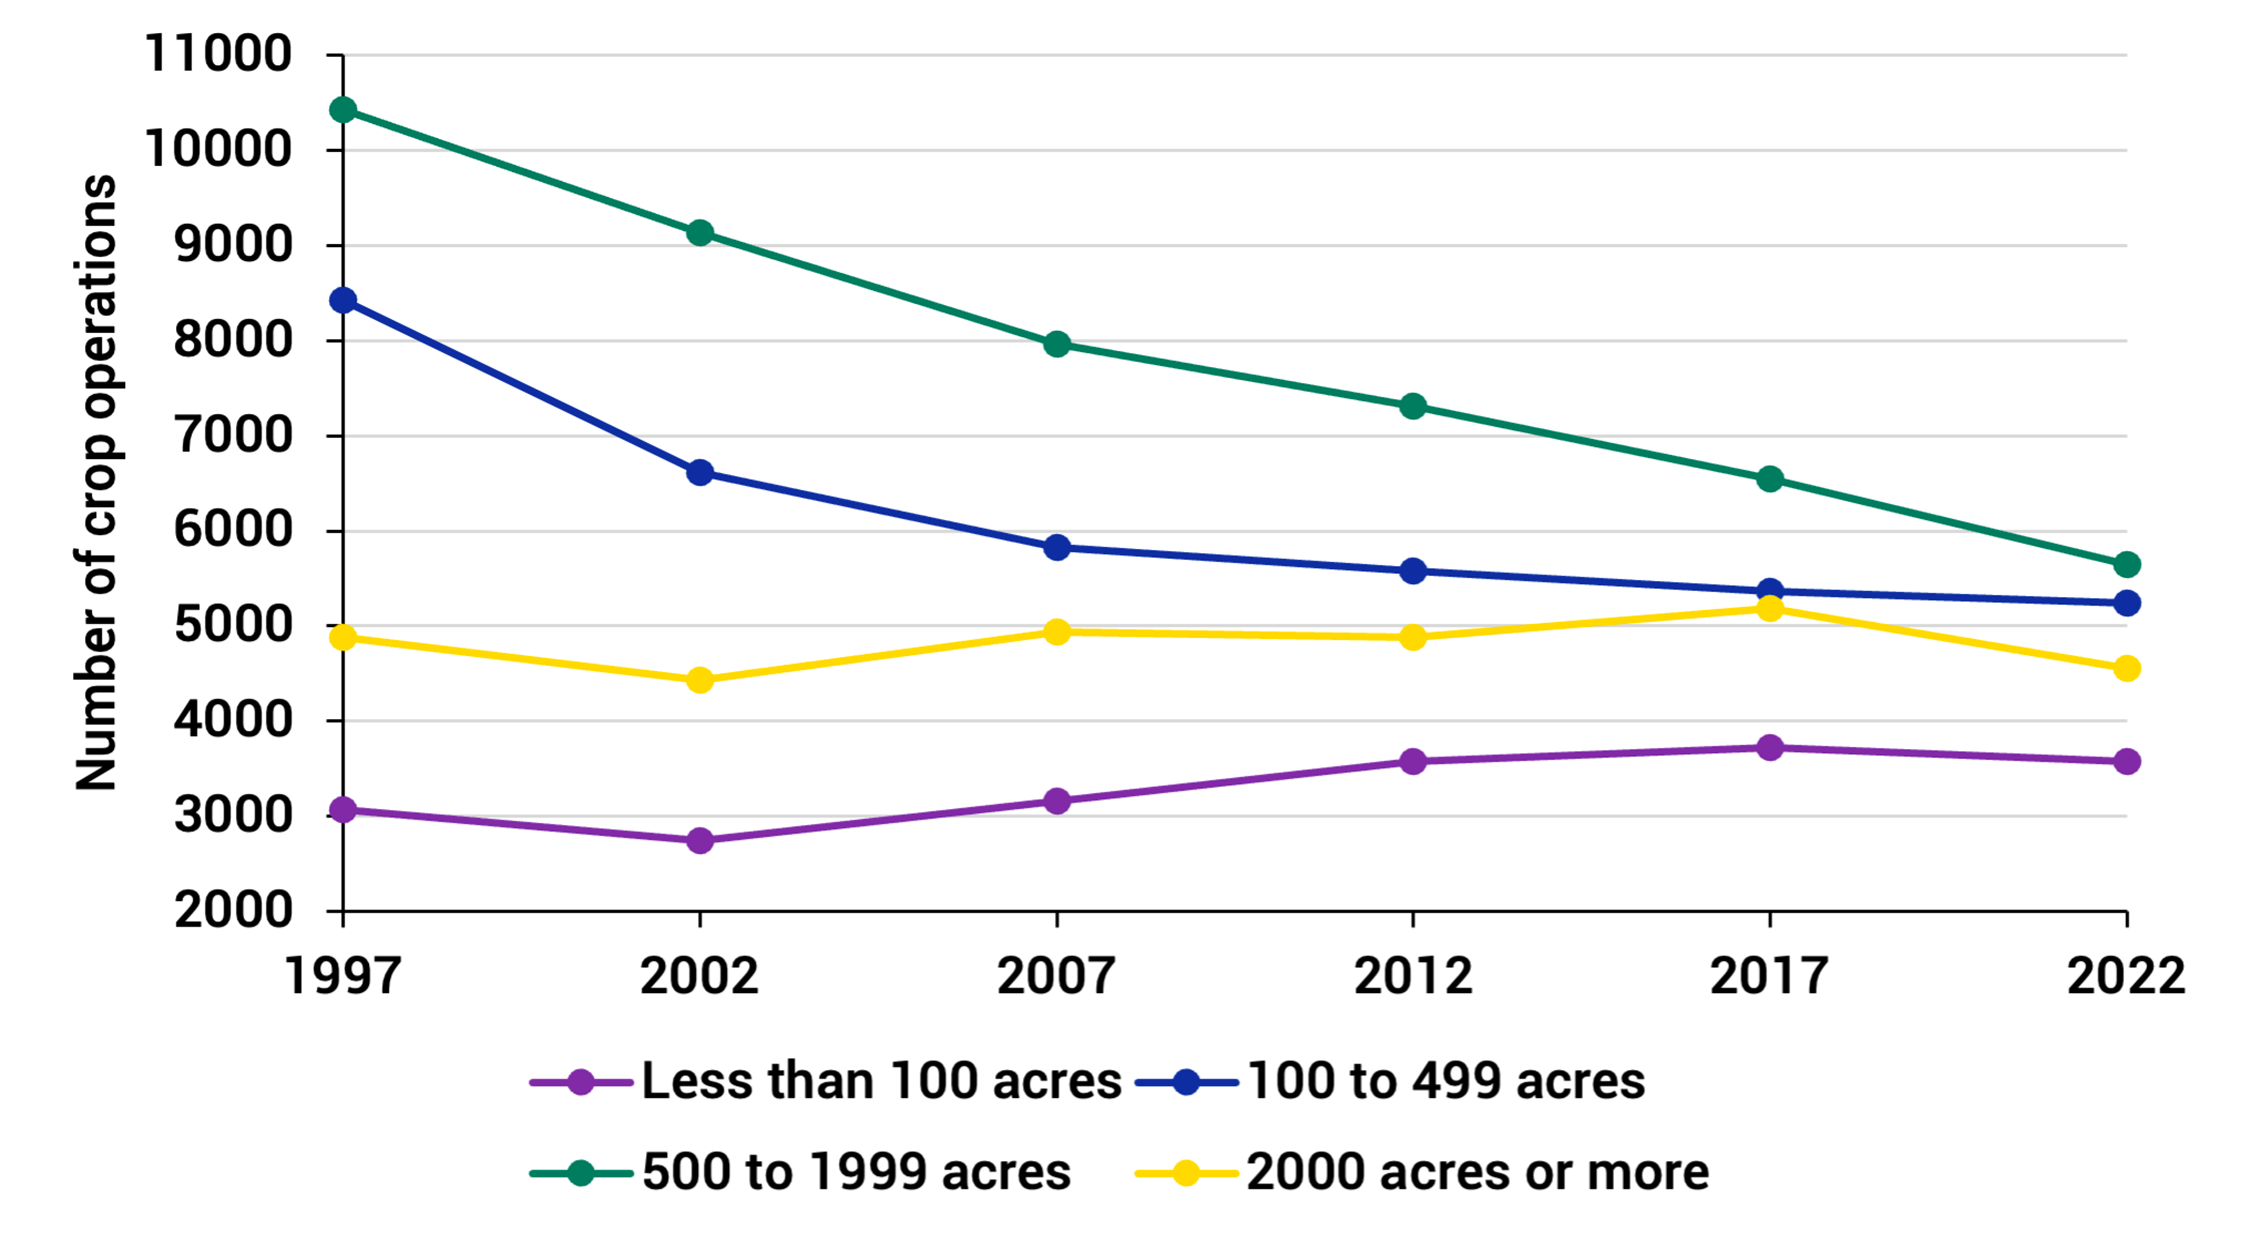
Meanwhile, the proportion of small or hobby farms has been increasing over the years, from 11% to nearly 20% of the total farm numbers during 1997-2022 (Figure 5). One likely reason is that amid the rising land values (USDA, 2023), small farms are more affordable for new operators entering the farming businesses.
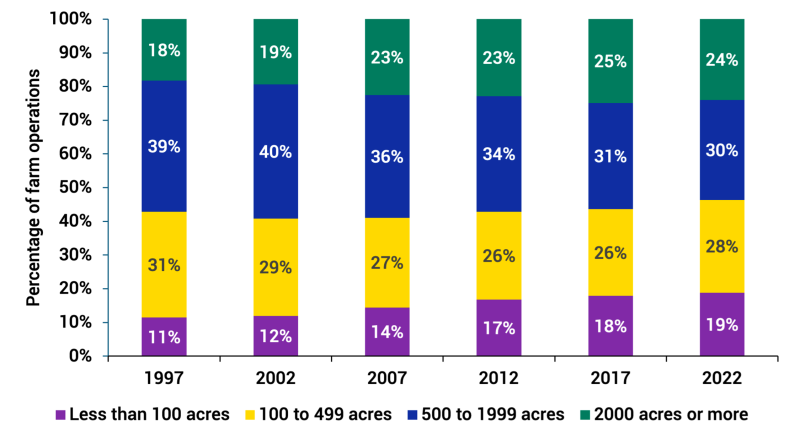
In comparison to the rapidly increasing proportion of farmland operated by large-scale farms, the total crop areas operated by small farms remain low throughout the years. According to Figures 1 and 5, small-scale farms (<100 acres), which account for nearly 20% of South Dakota farms, operate only less than 1% of the cropland acres in 2022.
Cropland Acres
Cropland acres increased considerably during 2002-2017 period and the total cropland operated increased by 21%. Such an increase in cropland is at the expense of grassland loss, as the cropland to grassland conversion rate was at all-time high during that time, driven primarily by high crop commodity prices (Wang et al., 2017; Wimberly et al., 2017). From 2017 to 2022, total crop acres operated declined by nearly 7% (Figure 3). Cropland to grassland conversion has partly contributed to such a decline, as some farmers have converted their marginal lands, or land affected by saline and sodium conditions, to grassland.
References
- MacDonald, James M., Korb, P., & Hoppe, Robert A. (2013). Farm Size and the Organization of U. S. Crop Farming. U.S. Department of Agriculture, Economic Research Service, EIB-152. August.
- U.S. Department of Agriculture (USDA) National Agricultural Statistics Service (NASS) (2022). 2022 Census of Agriculture.
- USDA (2023). Land values 2023 summary.
- Wang, T., Luri, M., Janssen, L., Hennessy, D. A., Feng, H., Wimberly, M. C., & Arora, G. (2017). Determinants of motives for land use decisions at the margins of the Corn Belt. Ecological economics, 134, 227-237.
- Wang, T., Jin, H., Kreuter, U., and Teague, R. (2021). Expanding grass-based agriculture on marginal land in the US Great Plains: The role of management intensive grazing. Land Use Policy, 104, 105155.
- Wimberly, M. C., Janssen, L. L., Hennessy, D. A., Luri, M., Chowdhury, N. M., & Feng, H. (2017). Cropland expansion and grassland loss in the eastern Dakotas: New insights from a farm-level survey. Land Use Policy, 63, 160–173.doi:10.1016/j.landusepol.2017.01.026


