Cover crops serve as a ground cover when cash crop is absent and add biological variety to the soil, which therefore fulfill the two important soil health building principles: keeping the ground covered and boosting crop varieties. The use of cover crops has multiple environmental benefits such as increasing soil organic matter, reducing soil erosion, suppressing weeds and preventing nutrients and chemical runoff into surface water. Cover crops absorb soil moisture and allow earlier field access during wet springs. Cover crops can also increase soil infiltration rate and minimize cash crop yield loss in drought years. To help more producers adopt cover crops and realize the aforementioned benefits, economic incentives through NRCS Environmental Quality Incentives Program (EQIP) and Conservation Stewardship Program (CSP) are provided to promote cover crop adoption and continual usage.
In the recent years, many surveys have been conducted in different regions of the U.S. For example, an annual survey conducted by Sustainable Agriculture Research and Education (SARE)/Conservation Technology Information Center (CTIC), which include approximately 2,000 responses nationwide, indicated more producers start to use cover crops in recent years (CTIC, 2017). To learn more detailed information about producers’ usage status of cover crops in South Dakota (SD), we sent out a survey in spring 2018 to 3,000 producers in SD. Together we received 708 responses, which accounts for 30% of the eligible farm sample.
Cover Crop Usage Status in South Dakota
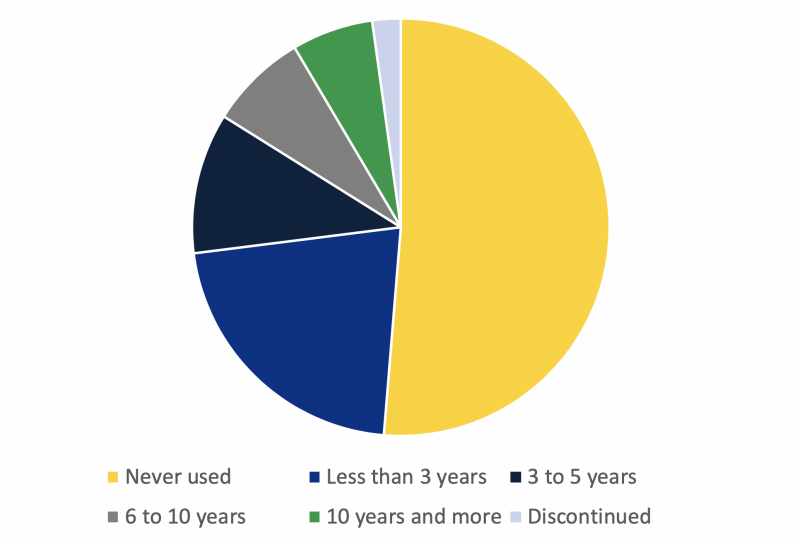
Among the respondents who identified their cover crop usage status, more than half had not yet tried cover crops as of 2018 (Figure 1), which shows that the practice of cover crops is relatively new and not yet widespread. Among the users, there are more users in the category with fewer usage years, for example, only 6.3% reported using cover crops for more than 10 years, 10.9% used it for 3 to 5 years, while and the majority of users (21.7%) used cover crops for less than 3 years. Such a trend indicated that the adoption of cover crops has accelerated in the past 10 years.
Years of Usage and Percent of Land Devoted to Cover Crops
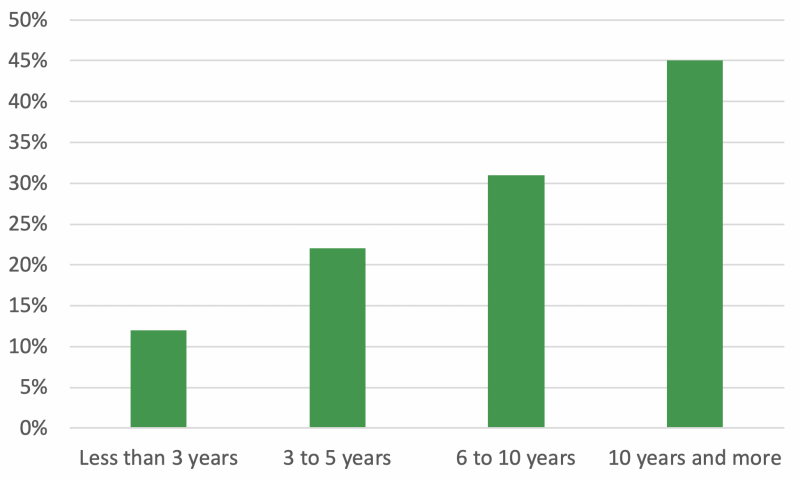
A clear trend from Figure 2 is that farmers who use cover crops for longer period have expanded its usage to a higher proportion of their operated land. For beginner users with less than 3 years of experience, their cover crop acreage only accounted for 12% of their total operated land, while for those users with 10 years or more experiences, cover crop acreage accounted for 45% of the total land. The trend that cover crop acreage grows with experience implies that most of the SD cover crop users start by trying it on a relatively small number of acres, then after some years of trial and error, most of the users are willing to devote more farm acres to cover crops when they experience more of the benefits.
Years of Usage and Profit Change After Adoption of Cover Crops
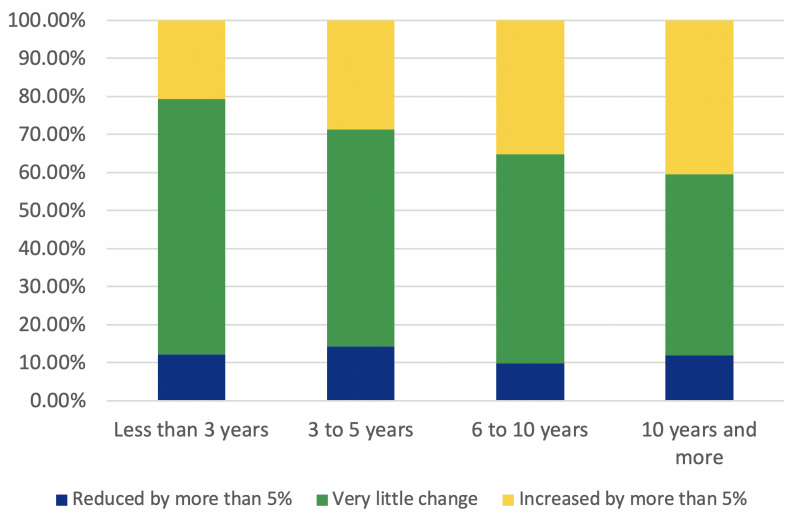
We can see from Figure 3 that producers’ opinions on profit change because of cover crop adoption also become more favorable as the usage years increase. While only 20% of users with less than 3 years of experience viewed it as profitable, this figure gradually increased with years of experience, reaching 40% for users with more than 10 years of experience. Despite the increased seed cost, the majority of producers viewed cover crop practice as either increasing profits or having little change on profits. Only about 10% of users of different usage categories perceived a drop in profit by more than 5% after cover crop adoption. Figure 3 suggests that in addition to its soil and environmental benefits, cover crops also make economic sense for most of the users as well.
Overall, our survey findings showed that the number of SD producers who use cover crops is increasing at an accelerating rate over the past ten years. Moreover, users with longer experience are more likely to perceive an increase in profits and therefore expand cover crop usage to more of their farm acres. With both an increase in the number of new adopters, and an increase in number of cover crop acreage for existing users, cover crop planted acres have increased rapidly over the past decade. Nevertheless, our survey results show that as of 2018, cover crops are only used on 13% of the farmland on average, as indicated by our survey respondents. To further boost cover crop adoption, it is necessary to learn about non-adopters’ major challenges with cover crops and provide more learning opportunities to address them.
Acknowledgement: This article is based upon research work that is financially supported by South Dakota Corn Utilization Council.
Reference: Conservation Technology Information Center (CTIC). 2017. Report of the 2016-17 National Cover Crop Survey. Joint publication of CTIC, the North Central Region Sustainable Agriculture Research and Education Program, and the American Seed Trade Association. West Lafayette, IN.