Written collaboratively by Tong Wang and Stephen Cheye.
The recently released Agricultural Census data of 2022 (USDA, 2022) shows that the share of cropland acres under conservation practices has continued to increase in South Dakota (abbreviated as SD).
No-Till and Conservation Tillage
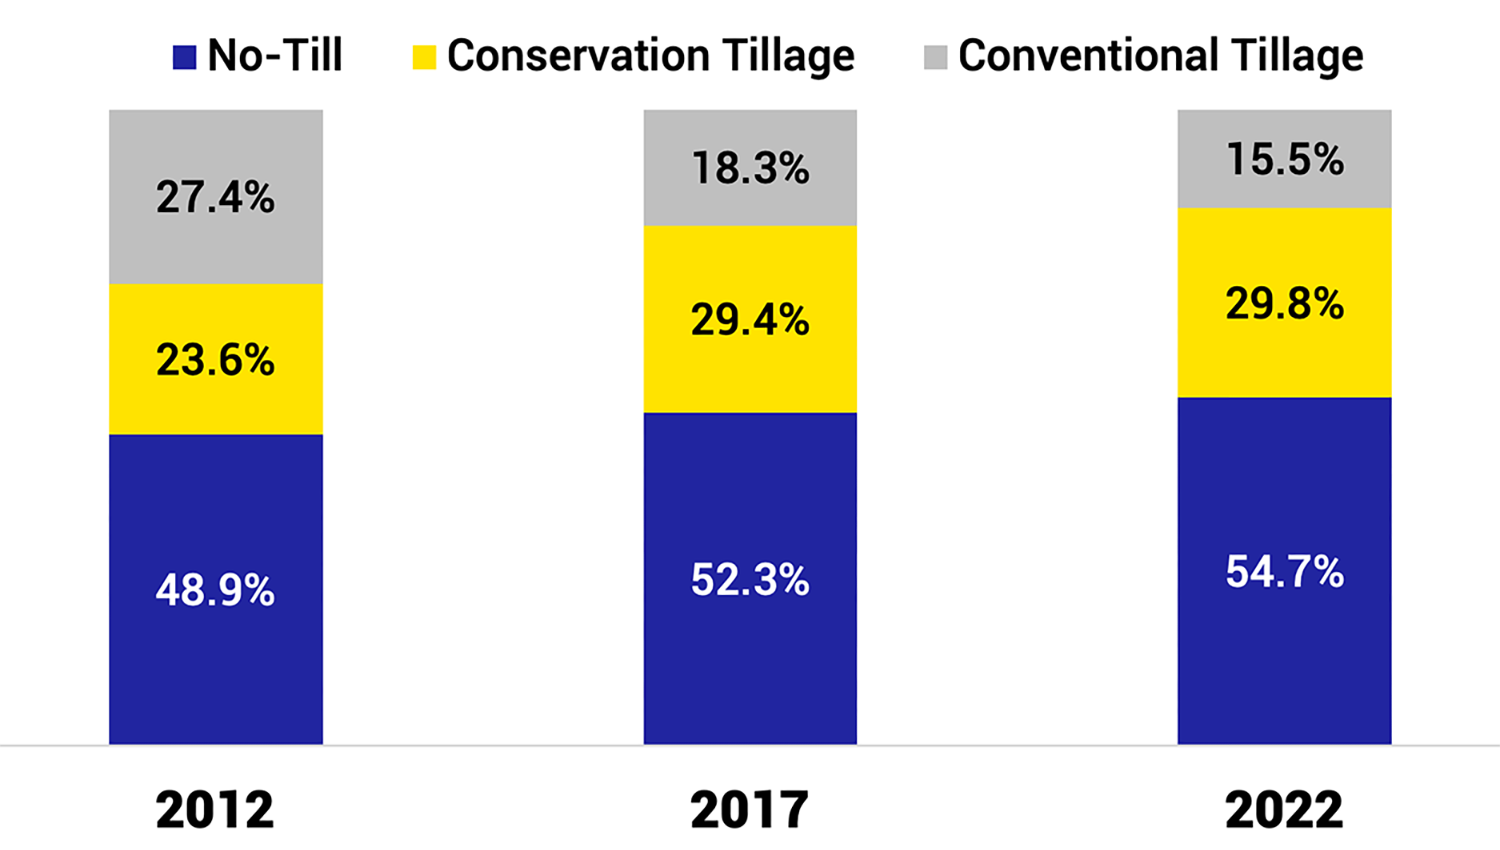
During 2012-2022, the percentages of cropland acres using no-till and conservation tillage practices both increased in SD, with the no-till share increasing from 48.9% to 54.7%, and conservation tillage share increasing from 23.6% to 29.8%. Correspondingly, the proportion of conventional tillage acres in SD has dropped from 27.4% to 15.5% in the meantime (Figure 1).
Figure 2 demonstrates the share of different tillage practices by county. No-till practice is mostly adopted in Central SD (Figures 2-A and 2-B). Among the Central SD counties, 12 counties (Brule, Buffalo, Campbell, Corson, Haakon, Hughes, Jones, Pennington, Potter, Tripp, Walworth, and Ziebach) had more than 80% of the cropland under no-till practice as of 2022. In contrast, the adoption rate of no-till remains low in Eastern SD, and 11 counties in Eastern SD (Brookings, Clay, Deuel, Grant, Hamlin, Kingsbury, Lake, Lincoln, Moody, Roberts, and Turner) have less than 20% of the cropland adopted to no-till practice. Such regional differences in no-till adoption rates can be explained by the negative yield effect of no-till in regions with higher precipitation (Pittelkow et al., 2015). Compared to Eastern SD, Central SD has less precipitation; therefore, it is more likely to generate positive outcomes on crop yields (Saak et al., 2021).
In contrast to Central SD counties, where no-till is mostly used, conservation tillage is the most-adopted practice in Eastern SD counties (Figures 2-C and 2-D). Of the Eastern SD counties, 17 counties adopted conservation tillage on 40 to 60% of the cropland acres.
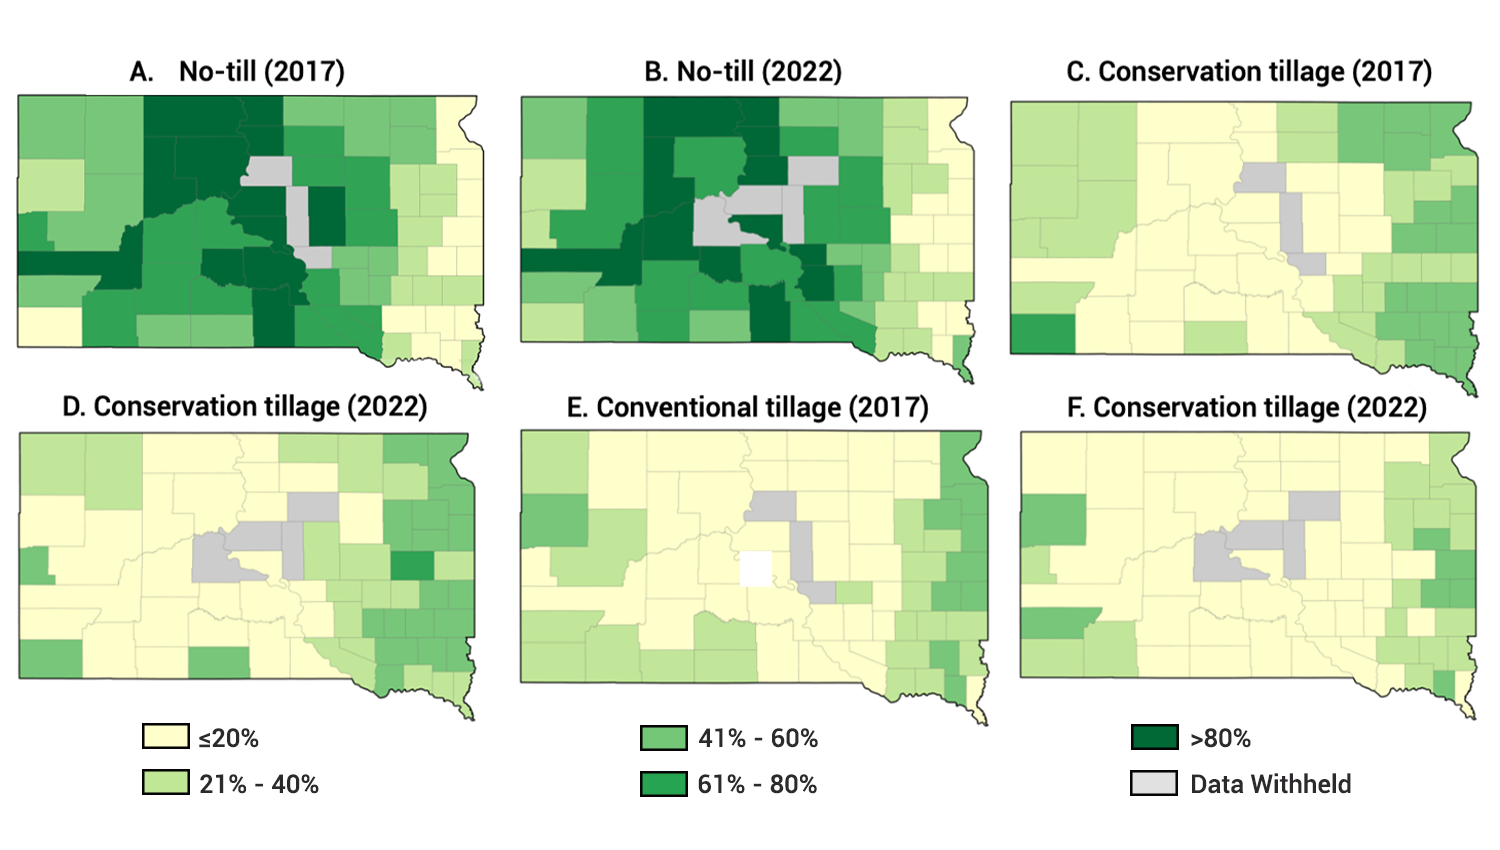
Note: The share of no-till practice is calculated as no-till acres divided by the sum of cropland acres under three tillage practices; similar calculations are done for conservation and conventional tillage practices.
Conventional Tillage
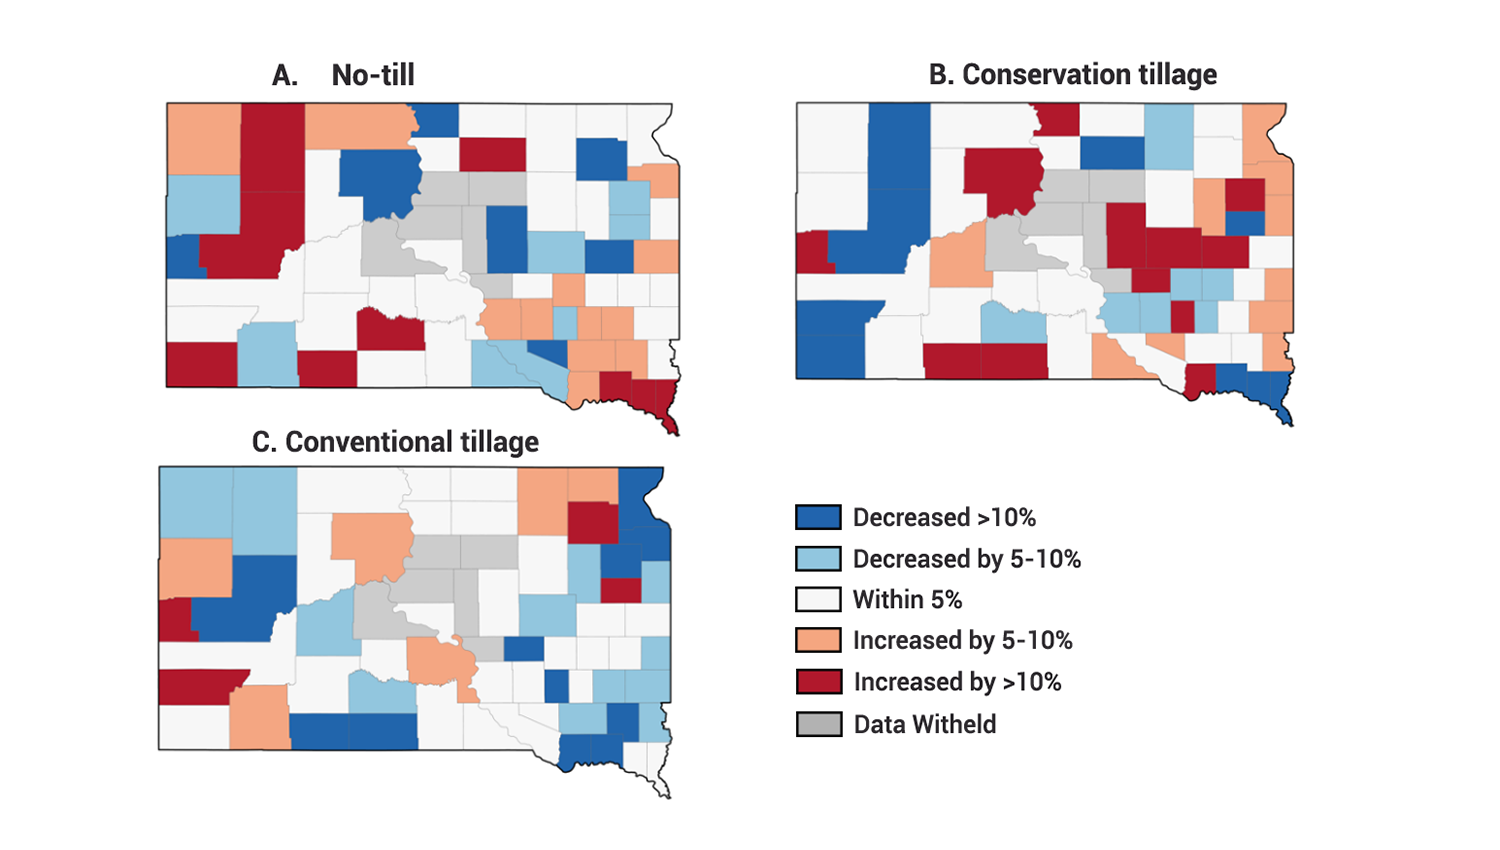
Conventional tillage is more commonly used in Eastern and Western SD (Figures 2-E and 2-F). The top concern expressed by Eastern SD farmers for not adopting no-till and conservation practices was delayed planting caused by slow soil warming in the spring (Adhikari et al., 2023). In 2017, nine counties along the east ern border of SD had 41 to 60% of cropland under conventional tillage. During 2017-2022, the usage of conventional tillage has dropped in Eastern SD, and only five counties in Eastern SD had 41 to 60% of cropland under conventional tillage. In most Eastern SD counties, conventional tillage shares declined by over 5% during 2017-2022, where the adoption of conservation tillage has increased accordingly (Figure 3). In Southeast SD counties, the declines in conventional tillage acres were often accompanied with an increase in no-till acres.
Cover Crops
Of the total harvested acres in SD, the acres planted with cover crops in 2012 was less than 1%. The overall cover crop share in SD increased to 1.7% in 2017 and 2.3% in 2023. For most Eastern SD counties, the acres of cover crops were less than 2% of the harvested crop acres in 2017 (Figure 4-A), which increased to more than 3% by 2022 (Figure 4-B). Among those, seven counties (Codington, Day, Lincoln, Marshall, Roberts, Turner, and Yankton) had more than 4% of the total harvested acres planted with cover crops as of 2022. During 2017-2022, the shares of acres under cover crops increased by more than 2% for most counties located in Northeastern SD (Figure 4-C).
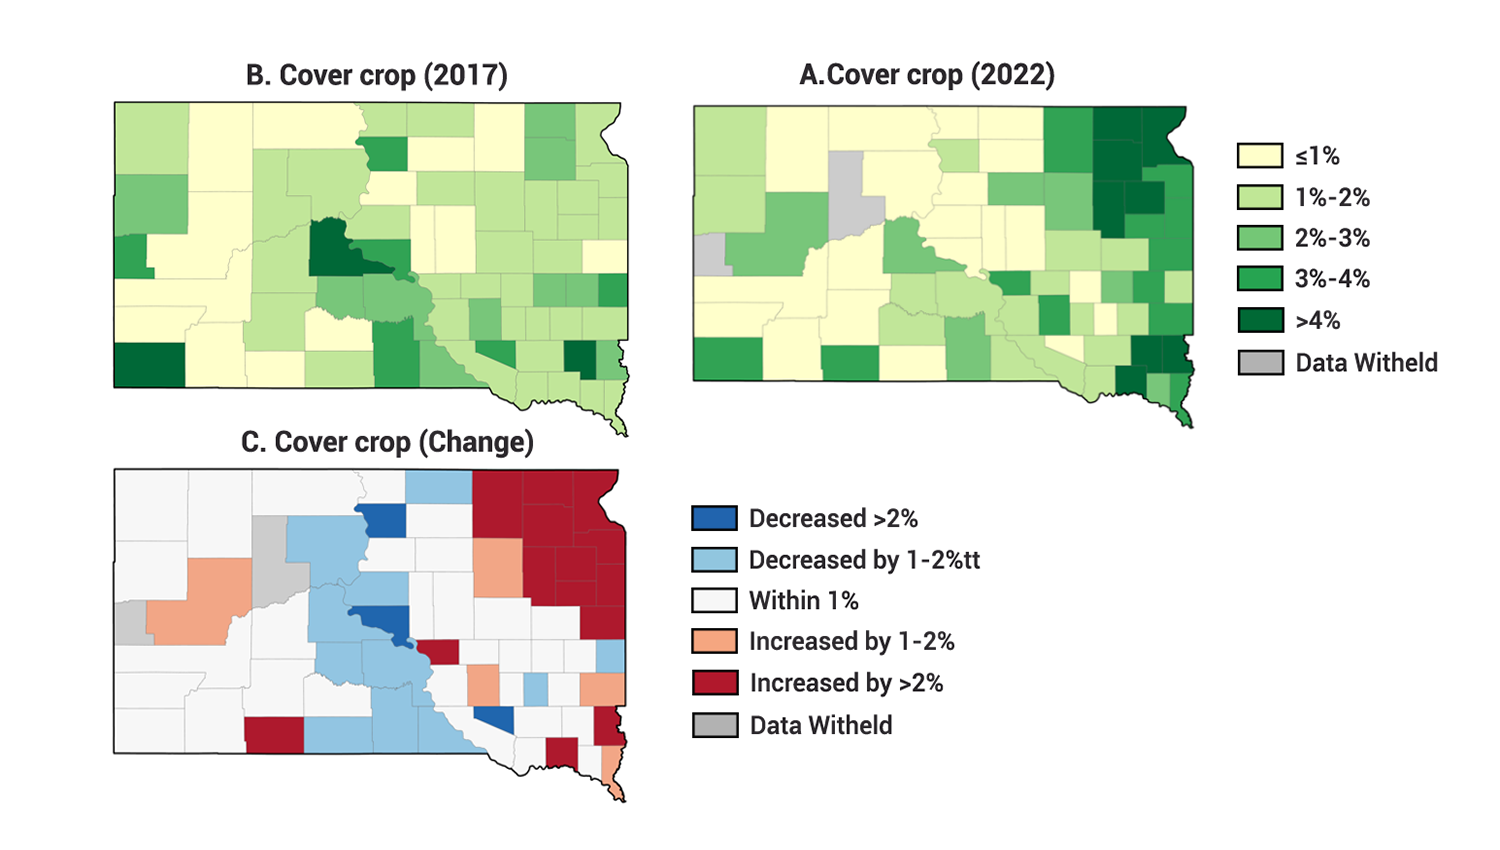
Note: The share of cover crop acres is calculated as cover crop acres divided by the harvested cropland acres.
Eastern SD is one of the most-affected regions during the 2019 flood. Producers can receive a $15/acre payment through the Market Facilitation Program if they planted cover crops on the prevented planting acres (USDA, 2019). According to a recent study, cover crops can help reduce the likelihood and magnitude of prevented planting (Won et al., 2023). Factors, such as increase in extreme weather events and better understanding of cover crop benefits, could have contributed to the rapid increase in cover crop acres in Eastern SD.
References
- Adhikari R., T. Wang, H. Jin, J. D. Ulrich-Schad, H. Sieverding, and D. Clay. 2023. Farmer perceived challenges to conservation practice usage in the margins of Corn Belt, U.S.A. Renewable Agriculture and Food Systems, 38, e14, 1–14. .
- Pittelkow, C. M., B. A. Linquist, M. E. Lundy, X. Liang, K. J. Van Groenigen, J. Lee, ... & C. Van Kessel. 2015. When does no-till yield more? A global meta-analysis. Field Crops Research, 183, 156-168.
- Saak A. E., T. Wang, X. Zheng, D. Kolady, J. D. Ulrich-Schad and D. Clay. 2021. Duration of usage and farmer reported benefits of conservation tillage. Journal of Soil and Water Conservation, 76(1): 52-62.
- U.S. Department of Agriculture (USDA). 2019. USDA using flexibility to assist farmers, ranchers in flooded areas. [Last accessed on April 1, 2024].
- USDA, National Agricultural Statistics Service (NASS) (2022). 2022 Census of Agriculture.
- Won, S., R. M. Rejesus, B. K. Goodwin, and S. Aglasan. 2023. Understanding the effect of cover crop use on prevented planting losses. American Journal of Agricultural Economics, 106(2), 659-683.