Water
All Water Content
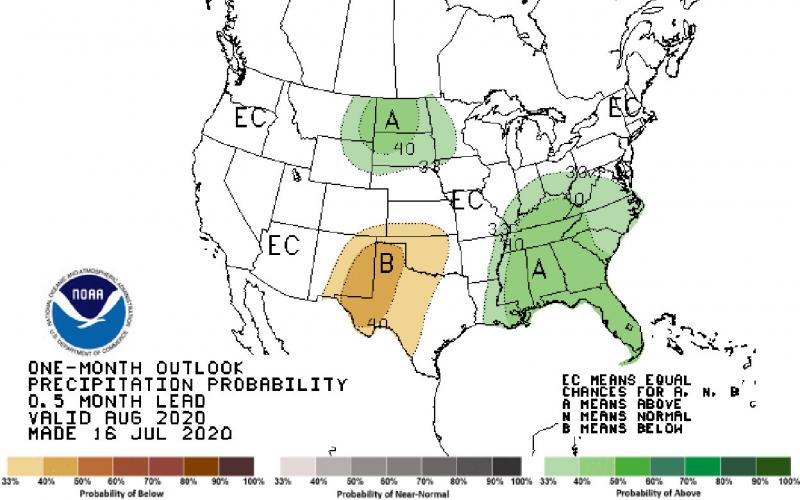
Late Summer 2020 Climate Outlook
Drought concerns in South Dakota may be relieved later this summer, according to the NOAA Climate Prediction Center’s seasonal outlook released this week.
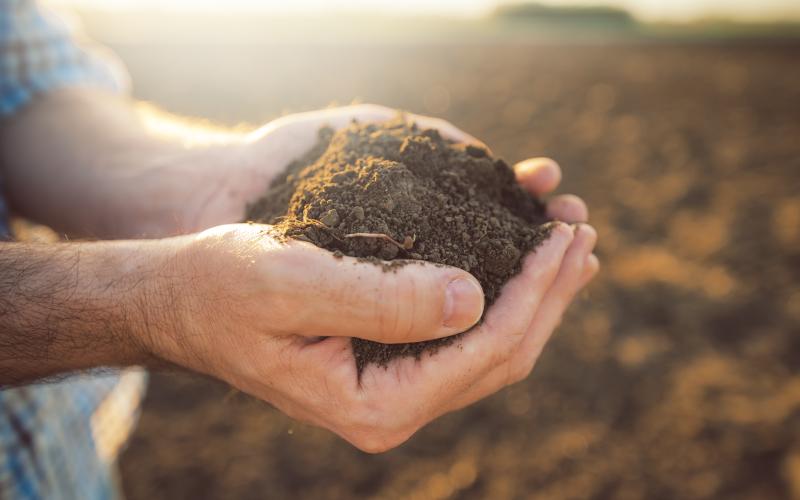
X-Ray Scanning Confirms Soil Health Benefits from Conservation Practices
Summary report of X-ray scanning confirms soil health benefits from conservation practices.
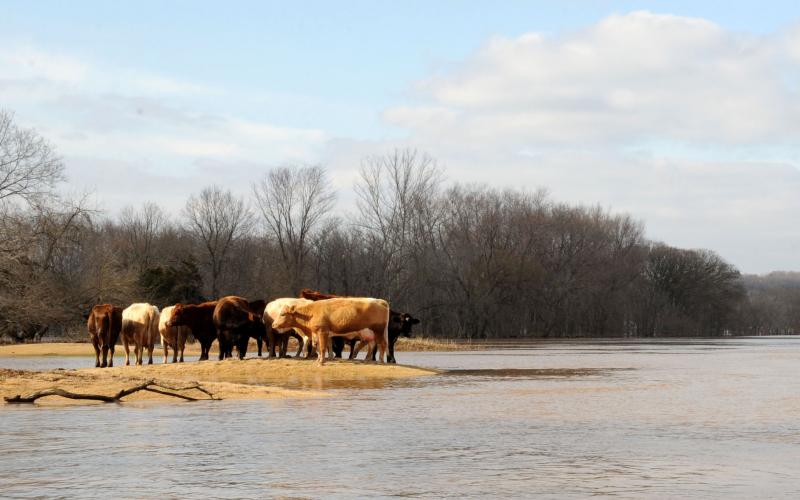
Preserving Your Ability To Care for Your Animals When Flooding Occurs
When winter snowfall begins to melt, severe spring flooding can be a real possibility. Of the people witnessing the rising water, livestock producers and other animal caretakers have perhaps the most daunting task.
Dealing With Spring Mud and Flooding
As the snow melts, we are going to be left to deal with mud at a minimum and extensive flooding as a possible worst-case scenario. While we can’t control the pace of melting or the possibility of additional precipitation, we may be able to take a few steps to mitigate the negative impacts.
Spring Climate Outlook Unclear Amid Drought Concerns
February 22, 2021
In like a lion, out like a lamb?
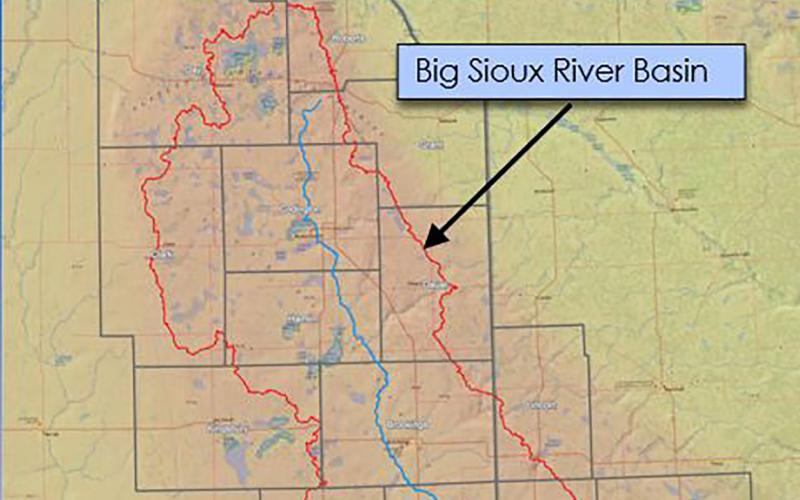
Big Sioux River Flood Information System Sees Heavy Use During Spring 2019
The Big Sioux River Flood Information System is the result of a combined effort between the SD Department of Environment and Natural Resources, local governments, and private industry, to create a product that can be used to predict the impact of flood events in the Big Sioux River Basin.
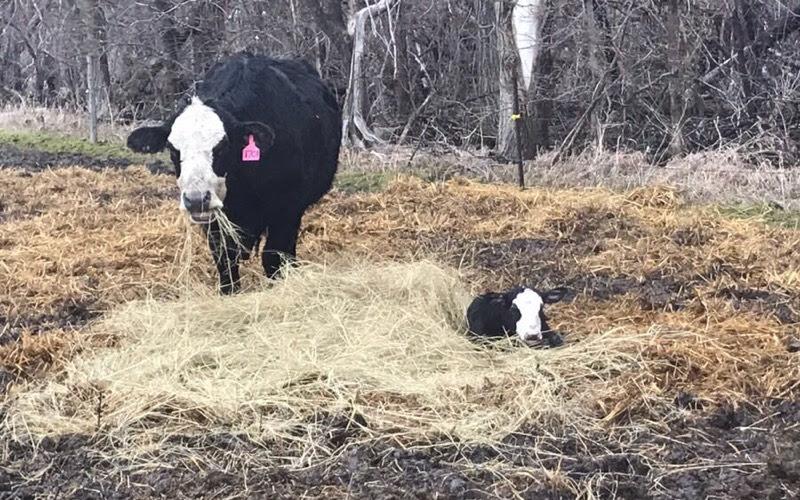
Planning for a Muddy Breeding Season
Early calving spring cow herds have wrapped up calving and are preparing for breeding season. If you are having flashbacks to breeding in the mud of 2018, try approaching this year with an open mind and review breeding season protocols with a “mud” backup plan.
Virtual Eastern South Dakota Water Conference to be Held October 14
September 22, 2020
The 2020 Eastern South Dakota Water Conference, sponsored by the South Dakota Water Resources Institute, will be held Wednesday, October 14, from 9:00 a.m. – 2:00 p.m.
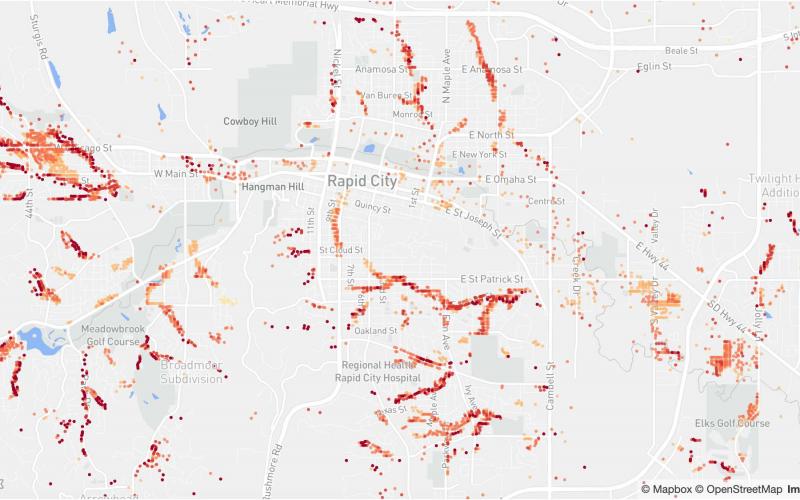
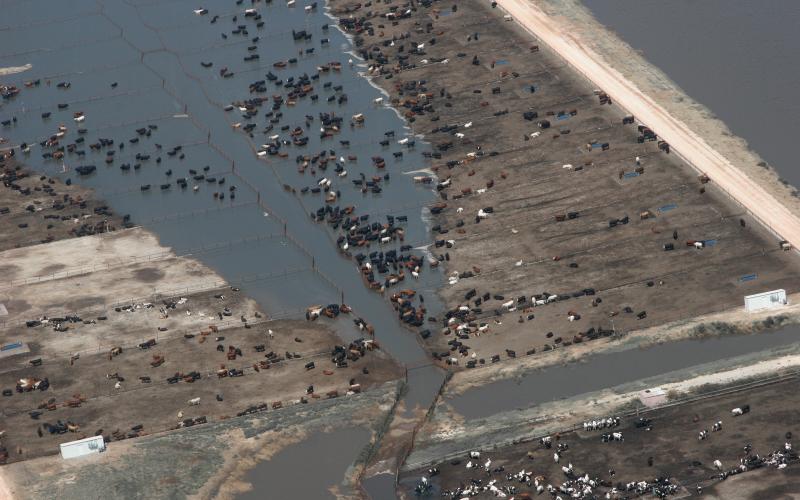
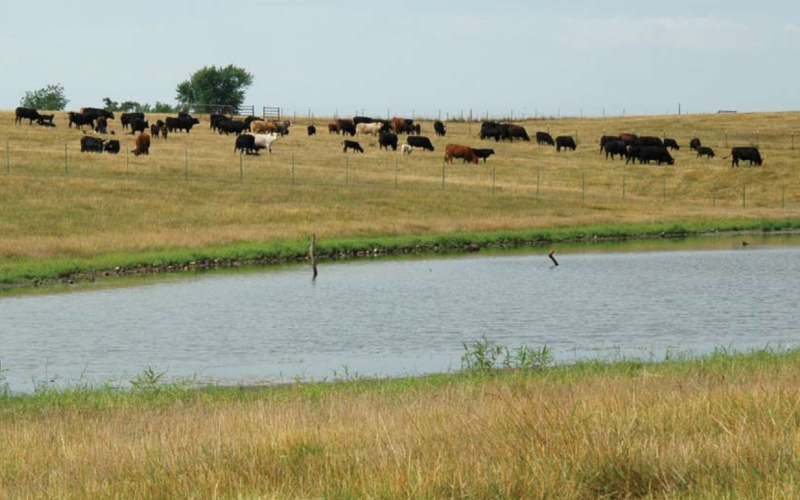
South Dakota’s Changing Flood Risk
South Dakota’s flood risk is increasing in some areas of the state according to a recent report from the First Street Foundation. In 2020, 62,600 total properties are at substantial risk, with a projected increase to 63,000 properties by 2050.
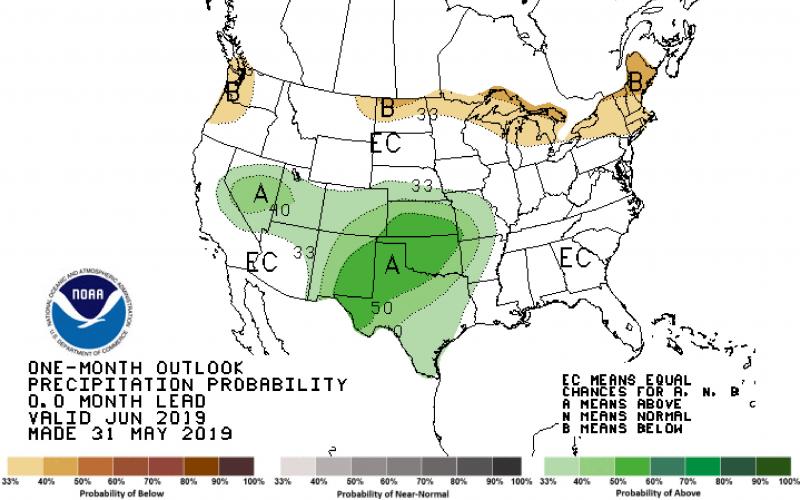
June 2019 Climate Outlook for South Dakota
As South Dakota emerges from the wettest 12-month period in 124 years of climate recordkeeping (June 2018-May 2019), June has started warmer and drier than average. The outlook, however, turns towards cooler and wetter than average again for the middle of the month.