South Dakota’s flood risk is increasing in some areas of the state according to a recent report from the First Street Foundation. In 2020, 62,600 total properties are at substantial risk, with a projected increase to 63,000 properties by 2050. In comparison, the FEMA Flood Insurance Rate Maps currently identify 24,900 properties as having substantial risk.
In summer 2020, the nonprofit research group First Street Foundation published a comprehensive national report on the state of flood risk in the continental U.S. The findings were produced from the Foundation’s Flood Model which assesses flood risk at a very high resolution, at the level of individual properties. The report provides an overall assessment of flood risk for the U.S. but also provides details for each state, county and city. Current flood risk is presented alongside projections of up to 30 years in the future.
A key finding in the report indicates that many more American homes and businesses are currently at risk of severe flooding compared to properties located in the Federal Emergency Management Agency’s (FEMA) existing floodplain maps, called Special Flood Hazard Areas (SFHA). The Foundation’s Flood Model identifies approximately 1.7 times the number of properties facing substantial risk in 2020 compared to the FEMA SFHA designations. According to the Flood Model, an estimated 14.6 million properties face significant flood risk compared to the 8.7 million properties at risk in the FEMA floodplain maps. This equates to an additional 5.9 million properties nationwide that are not currently identified within the FEMA SFHA zones. By 2050, the number of properties with substantial risk across the country is estimated to increase to 16.2 million.
In South Dakota, the city with the largest proportion of properties at risk is Sturgis, with 40 percent of their properties at risk in 2020. This number is virtually unchanged in 30 years’ time after taking into account projections of rain and river flooding. Other Black Hills communities of Hot Springs, Spearfish and Box Elder all have 20 percent or more of their properties at risk of flood, both now and in the year 2050. Rapid City has the highest number of total properties at risk of flooding, with over 4,500 today and a projected increase of almost 50 more by the year 2050. This does not include any new construction that may occur between now and then. The city of Aberdeen has the highest percentage increase of flood risk in the next 30 years, with a four percent increase in properties at risk. Currently, only about 10 percent of the city’s homes and businesses are at risk.
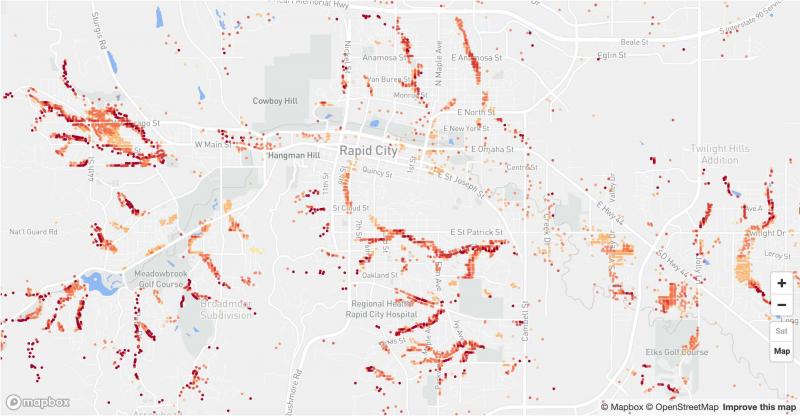
One difference between the First Street and FEMA SFHA designations is due to the fact that FEMA has not mapped all areas of the country. A second difference is that First Street uses current and projected precipitation and sea level data. While the FEMA designations use historic precipitation and disaster claim data to assess current risk, the First Street Flood Model applies global climate model and sea level rise projections to forecast how flood risk may change over the next 30 years. The flood model takes into account flooding due to rainfall, rivers, tides and storm surge in addition to mitigation or protection measures that are in place, such as dams and levees. The model then assigns each property a flood score from 1 (the lowest risk) to 10 (the highest). Flood risk is determined by inundation of 1 cm or more to a building in a 500-year return period (or 0.2% chance per year). Details on their flood risk methodology can be found on the Flood Factor website. Figure 1 shows an example of the flood risk score for the Rapid City area as determined by the First Street Foundation’s method.
It is thought that realtors, homebuyers, and property owners will be able to access and use this kind of flood information side by side with other neighborhood information when making purchasing decisions. Flood risk from sources like this could someday be used by home and property owners to decide whether they want to purchase flood insurance as well. Community leaders and emergency managers can begin to use these and similar flood risk and inundation maps to aid in city planning for areas of future development, as well as disaster/hazard planning and determining where to implement mitigation measures.
Additional Resources
- The First National Flood Risk Assessment: View the First Street Foundation’s full 2020 report and South Dakota’s state overview.
- Flood Factor Tool: Use the First Street Foundation’s free, online tool to find your home’s flood factor.