Written collaboratively by Alex McLain and Deepthi Kolady. Reviewed by Heather Gessner.
What Is Soil Organic Matter?
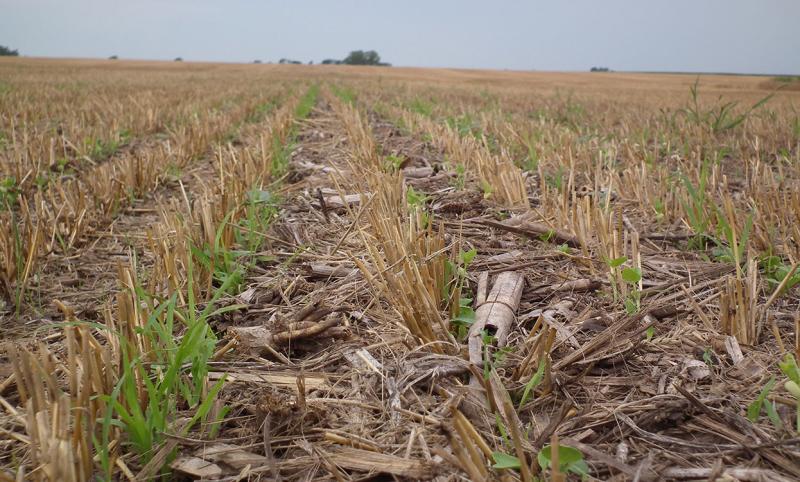
Conservation management practices, such as conservation tillage, cover crops, crop rotation and livestock integration have improved adopters' soil health. Soil Organic Matter (SOM) is a biological soil health indicator that has also increased due to conservation management practices. SOM affects soil's physical, chemical and biological properties. SOM improves soil structure and reduces erosion, and it consequently improves soil quality, plant productivity and water quality (Ontil and Schulte 2012). The length of adoption of conservation management practices affects soil health and SOM improvements.
When producers decide to adopt management practices, how do they determine how much value additional SOM is bringing them? That is where fertilizers and fertilizer costs come into play.
SOM is mostly carbon, nitrogen, phosphorus, potassium and sulfur from decaying animal and plant tissues in the soil. Crops use the nitrogen, phosphorus, potassium and sulfur components of SOM as nutrients. Fertilizers can also provide these same nutrients. Therefore, we can use fertilizer prices to determine how much value producers receive from their SOM. Precision application of fertilizers can bring additional economic benefits.
In addition to the nutrients made available from SOM, producers may soon be able to generate value from the carbon component of SOM. Carbon is the largest component of SOM (~58%) (Griffin and Edwards 2020). Producers may be eligible for government programs for the amount of carbon sequestered in their soil. A Biden Administration proposal uses the Conservation Reserve Program and Conservation Stewardship Program to subsidize sequestering carbon in soils to reduce carbon emissions. With carbon usually composing around 58% of SOM, an increase in SOM could increase government payments from these programs.
Investigating Conservation Management Practices
During the Spring of 2019, we conducted a study that used data from producers in eastern South Dakota to determine the difference in soil health and SOM between adopters and non-adopters of conservation management practices. The study also looked at how the length of adoption of practice affected soil health and SOM. Finally, we used fertilizer prices to determine how much value producers receive for their SOM. The data from 60 eastern South Dakota producers included information on management practices and results from a Comprehensive Assessment of Soil Health (CASH) test from soil samples. This CASH test included the SOM percentage and an overall health score, which rated each soil sample on a scale of 1–100 bases on its physical, chemical and biological properties. We also gathered fertilizer price data from a local fertilizer supplier (McLain, Deutz, et al. 2021).
First, we compared the overall soil health score and SOM between adopters and non-adopters of the four conservation practices (Table 1). Table 1 presents the number of adopters in each category of conservation practices in our sample and respective soil health indicators. The conservation column in Table 1 compares the average soil health score and SOM between those who had adopted at least one practice to those who have adopted none of the management practices.
| Variable |
|
|
|
|
|
|||||
|---|---|---|---|---|---|---|---|---|---|---|
| Adoption |
|
|
|
|
|
|
|
|
|
|
| Adoption frequency (#) |
|
|
|
|
|
|
|
|
|
|
| Overall Health Score (0-100) |
|
|
|
|
|
|
|
|
|
|
| SOM (%) |
|
|
|
|
|
|
|
|
|
|
**, * indicate mean values are statistically significantly different between adopters and non-adoptersat 5% and 10% levels, respectively.
Source: Authors’ compilation using farm-level data.
Cover crops, crop rotations and livestock integration adopters all had significantly higher SOM than non-adopters. Those who adopted one or more practices also had significantly higher SOM than those who had adopted none of the practices. The adopters of management practices did not have significantly different overall health scores compared to non-adopters.
This shows that even though the overall health score may not respond to management practices, some soil health indicators, like SOM, may respond. When considering the length of management practice adoption, SOM significantly increased for those who have adopted cover crops for greater than 10 years compared to those who did not adopt (Table 2).
| - |
|
|
|
|
||||||||
|---|---|---|---|---|---|---|---|---|---|---|---|---|
| Length of Adoption |
|
(0-100) |
|
|
(0-100) |
|
|
(0-100) |
|
|
(0-100) |
|
| Not Adopted |
|
|
|
|
|
|
|
|
|
|
|
|
| <3 Years |
|
|
|
|
|
|
|
|
|
|
|
|
| 3-5 Years |
|
|
|
|
|
|
|
|
|
|
|
|
| 6-10 Years |
|
|
|
|
|
|
|
|
|
|
|
|
| >10 Years |
|
|
|
|
|
|
|
|
|
|
|
|
* indicate mean values are statistically significantly different between averages at 10% level.
Source: Authors compilation using farm-level data.
Using fertilizer prices, we were able to determine the value of each nutrient that makes up SOM. These prices were 34 cents, 34 cents, 28 cents and 41 cents per-pound for nitrogen, phosphorus, potassium and sulfur, respectively.
We used generally-accepted nutrient compositions of SOM to determine yearly, per-acre, nutrient availability. We detail these assumptions here.
- The top 6 inches of an acre of soil weighs 2,000,000 pounds, 1% SOM would then be 20,000 pounds.
- Nitrogen makes up 5% of SOM, phosphorus, potassium and sulfur each makes up 0.5% of SOM. Thus, providing 1,000 pounds of nitrogen and 100 pounds of phosphorus, potassium and sulfur.
- SOM has a 2% decomposition rate, so 20 pounds of nitrogen and 2 pounds of phosphorus, potassium and sulfur are available to crops on each acre each year.
Then multiplying the value per pound by pound per 1% of SOM, we get $6.74, 68 cents, 55 cents, and 82 cents value of 1% of SOM from nitrogen, phosphorus, potassium and sulfur, respectively. Adding these values gives us $8.79/%SOM/acre/year. Thus, the producer generates $8.79 worth of fertilizer from each 1% of SOM per acre (Table 3).
| Nutrient |
Price ($/ton) A |
Nutrient B |
of Nutrient C = [A÷(B÷100)]÷2000 |
Available/Acre/year D |
of % SOM E = C×D |
| Nitrogen (N) |
|
|
|
|
|
| Phosphorus (P) |
|
|
|
|
|
| Potassium (K) |
|
|
|
|
|
| Sulfur (S) |
|
|
|
|
|
|
|
|
|
|
($/1% SOM/acre/year) |
|
*Phosphorus fertilizer also includes 18% nitrogen which is taken into account in the value of phosphorus.
Source: Authors' calculation.
If we compared a quarter section from two different fields, Field A with 2% SOM and Field B with 5%, Field A would generate $2,813 from the SOM while Field B would generate $7,032.
Like our earlier analysis on SOM, cover crops, crop rotations, livestock integration, and conservation adopters generated more value from SOM than non-adopters (Table 4).
| Variable |
|
|
|
|
|
|||||
|---|---|---|---|---|---|---|---|---|---|---|
| Adoption |
|
|
|
|
|
|
|
|
|
|
| Adoption frequency (#) |
|
|
|
|
|
|
|
|
|
|
| SOM Value ($/acre/year) |
|
|
|
|
|
|
|
|
|
|
**, * indicate mean values are statistically significantly different between adopters and non-adopters at 5% and 10% levels, respectively.
Source: Authors’ calculation.
The values calculated in Tables 3 and Table 4 do not include potential income from carbon sequestered in soil per-acre. A one percent increase in SOM captures about eight tons of carbon, so if a farmer increases soil organic matter from 1% to 2%, they store eight tons of carbon per-acre. The proposed carbon payments per ton of carbon (C) sequestered per-acre range from $5 to $100. If we assume a very conservative value of $5/ton C sequestered/acre, a one percent increase in SOM generates $40/per-acre under the proposed carbon payment programs. The total value (fertilizer substitution + carbon payments) from a 1% increase in SOM from each acre each year calculates to $48.79. This calculation does not include SOM’s effect on crop yield, an aspect that has to be evaluated in future research.
When considering the adoption of management practices, it is also essential to consider other management, environmental and economic factors. Changes in soil health and SOM from management practices may be dependent on site-specific factors. The soil types present in the field can affect how the soil reacts to changes in management practices. Also, rainfall and other climatic factors may affect if management practice adoption is the most-profitable choice for a producer. Finally, analyze any changes to input costs or additional purchases necessary to adopt conservation practices when adopting management practices.
In Conclusion
In conclusion, conservation management practices, such as conservation tillage, cover crops, crop rotations and livestock integration improve soil health over time. By substituting SOM for fertilizer, we showed that adopting conservation management practices has economic benefits, which are more concrete than the abstract soil health concept. Realization of these economic benefits by adopters of conservation practices can occur in the short-term. Producers who adopt conservation management practices may also be eligible for additional payments through the proposed carbon markets program.
Questions remain regarding the successful implementation of carbon payment programs for agricultural landowners, including those related to measurement, verification and permanency. However, the carbon payment program is a widely discussed and debated topic among researchers, policymakers, environmental organizations, private sector companies interested in carbon markets, and producers. In short, conservation management practices provide benefits for both producers and the environment.
Acknowledgment: Authors acknowledge the financial support from USDA NRCS (grant # NR186740XXXXG006) for the research.
References:
- Griffin, E. and T. Edwards. (2020). What is soil organic carbon?. Retrieved 2/26/2021, 2021.
- McLain, A., A. P. Deutz and D. Kolady (2021). Conservation agriculture practices and soil health: An economic analysis of soil organic matter. Southern Agricultural Economics Association. Virtual, SAEA.
- Ontil, T. A. and L. A. Schulte (2012). "Soil carbon storage." Nature Education Knowledge 3 (10): 35.