Originally authored by Alvaro Garcia, former SDSU Extension Agriculture & Natural Resources Program Director.
Corn grain has been for a long time the world standard when it comes to energy feeds for livestock. It has been traditionally a quite homogeneous, energy-dense feed, only surpassed from this perspective by oils and fats or by other feedstuffs also rich in lipids. The history of heavy grain feeding to fatten cattle started in the U.S. at the turn of the 19th century in the Ohio Valley region. Corn production continued to rise, leading to an oversupply that drove prices down, until the depression era in the 20th century when the U.S. government began to regulate production. It was the government of Franklin D. Roosevelt that paid subsidies to farmers so they would not plant any more corn. This regulation operated through the early 1970’s, when a corn epidemic, a large corn sale to Russia also combined with a bad U.S. crop season made prices soar during the summer of 1973’.

Higher prices for the grain dragged with them nearly all the food chain, creating a shortage of animal proteins among other foods. As a result, the U.S. government at the time changed the support for corn (Agricultural and Consumer Protection Act of 1973), guaranteeing farmers a price through direct payments for every bushel produced. During 1974 corn prices tripled compared to just 4 years before. Early into the 21st century (2005) the Energy Policy Act required more ethanol to be used as a bio-fuel; later on, in 2007, the U.S. government proposed a 20% reduction on the dependence of oil by 2017. Today nearly 35 percent of the corn crop goes to ethanol, and farmers have responded by increasing corn production even more. In spite of all these stimulus packages, it would be simplistic to blame government-supported programs for today’s oversupply of corn. Yes, farmers have been encouraged to plant corn as a result of those “subsidies”. However, if we look at the acres planted versus the bushels per harvested acre the real culprit has been technology (Graph). We are planting nearly the same acres as in the Second World War. We do not live in a world of “100-bushel corn” anymore however, but rather already encroaching the 200-bushel average. Add the recent trade/tariffs issues and we can clearly understand why U.S. corn prices are dismal. Modern technology and hybrids, coupled with worldwide access to information through the era of communications, have benefitted not only U.S. farmers but also those in the rest of the world. Today’s competition is wild and we need to find ways to “level the playing field”.
The Future of Corn Marketing
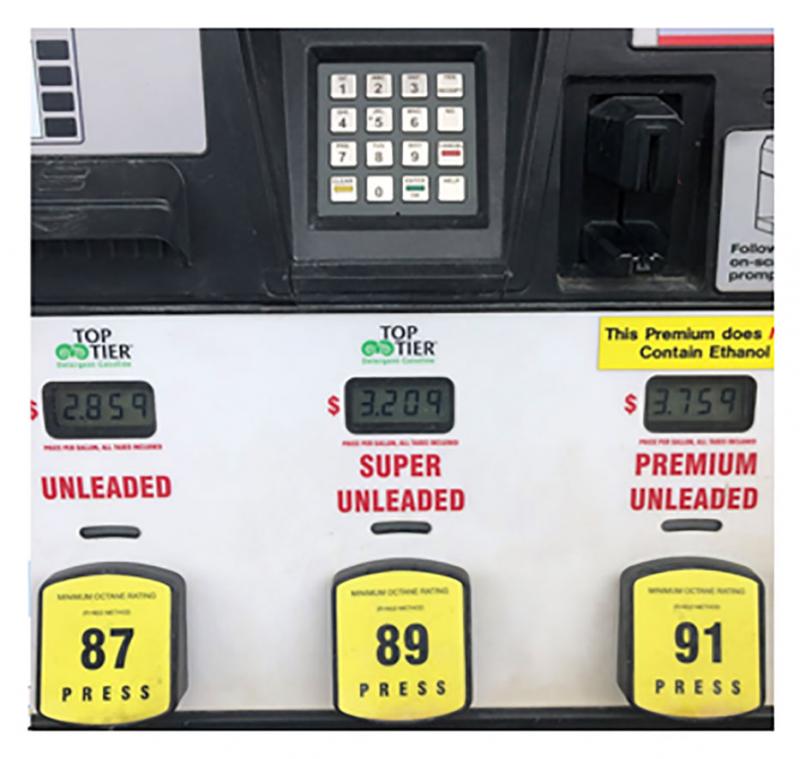
Barrels, bushels, metric tons, short tons, long tons. We are in the 21st century and for as long as anyone can remember we are selling grain by weight and and/or volume. The best we have come up to is a combination of both to obtain specific weight, at least for certain grains. That is pretty much it, with no mention whatsoever about nutrient content as it relates to livestock performance. Everyone can relate to different gas pump prices. All three blends in the picture are gasoline, however their price differs particularly depending on the performance expected from the vehicle. This is key to understand why we need to differentiate U.S. corn from that of other origins. Modern selected livestock breeds can outperform older genetics, provided they receive adequate “fuel”. Corn grain has also changed with the development of new hybrids, which yield more bushels per acre and more nutrients per bushel. This is particularly true in the U.S. and more so during the present century. The proposed reduction on the dependence on foreign oil together with the Energy Policy Act of 2005 led to the selection of corn hybrids that yield more starch and oil.
Back in the early 1970’s feed brokers/buyers as well as animal nutritionists operated under certain nutrient content assumptions for corn. The grain was sold as an energy feed with a very homogeneous nutrient concentration across markets with approximately 9-10 percent protein, 60 percent starch, and 3 percent oil. This corn was sold at the time on a per ton basis. Modern U.S. corn differs and contains 8-9 percent protein, 73 percent starch, and almost 4 percent oil. This modern U.S. corn is still sold today on a per ton basis! Some international brokers and even buyers still use the protein content in corn (10 percent reduction throughout the years) as a sales pitch, whereas very seldom stress the almost 22 percent increase in starch or 27 percent increase in oil over the years! Furthermore, what is truly important is not only the starch concentration per se, but how digestible it is, which is determined by its concentration of the prolamin “zein”.
We owe recent advances in our understanding of the impact of prolamins in corn to research conducted in part at the University of Wisconsin, Madison. Pat Hoffman and Randy Shaver from the Department of Dairy Science worked to elucidate their impact. Prolamins are proteins that are associated with the starch in corn (as well as other cereal grains). Prolamin in corn (zein) comprises 50-60 % of all protein in the kernel. Prolamin bonds are cross-linked and help encapsulate starch into water-tight globules. The starch present in vitreous dry corn is more intricately associated with this prolamin, increases its hydrophobicity, and reduces the accessibility of starch-degrading enzymes. It is precisely prolamin that is responsible for this vitreous characteristic of certain corn grain types that determine its digestibility, and thus how much energy can livestock obtain. Research at the University of Wisconsin demonstrated that digestibility decreased by 0.86 percentage units per percentage unit increase in grain prolamin (expressed as percent of starch).
Nutrient Content of Modern U.S. Corn
Each year the U.S. Grains Council publishes a very thorough report of the corn crop. For the 2017-2018 harvest the target population was yellow commodity corn from 12 key U.S. corn-producing states representing approximately 93.1% of U.S. corn exports. The number of samples collected (n = 627) was established so that the averages of quality factors had a relative margin of error (Relative ME) no greater than ±10 (95% confidence interval). Table 1 shows the results for the three major nutrients responsible for supplying energy: protein, oil, and starch. Results in table 1 are for the 2015-2017 harvest seasons, and the last 5-year average.
| 2017 Harvest | 2016 Harvest | 2015 Harvest | 5-Year Avg. (2012-2016) | ||||||||||
|---|---|---|---|---|---|---|---|---|---|---|---|---|---|
| No. Of Samples1 | Avg. | Std. Dev. | Min. | Max. | No. of Samples1 | Avg. | Std. Dev. | No. Of Samples1 | Avg. | Std. Dev. | Avg. | Std. Dev. | |
| U.S. Aggregate | U.S. Aggregate | U.S. Aggregate | U.S. Aggregate | ||||||||||
| Protein (Dry Basis %) | 627 | 8.6 | 0.55 | 6.4 | 122 | 624 | 8.6* | 0.5 | 620 | 8.2* | 0.53 | 8.7 | 0.58 |
| Starch (Dry Basis %) | 627 | 72.3 | 0.65 | 69 | 74.2 | 624 | 72.5* | 0.59 | 620 | 73.6* | 0.61 | 73.2 | 0.63 |
| Oil (Dry Basis %) | 627 | 4.1 | 0.22 | 3.3 | 5.5 | 624 | 4.0* | 0.23 | 620 | 3.8* | 0.3 | 3.8 | 0.3 |
As stated above, modern U.S. corn averages less than 9 percent protein, almost 73 percent starch and close to 4 percent oil. This has been the result of decades of selection for corn with higher content of energy yielding nutrients. Aside from strictly the nutrient content there is an urgent need to also assess what proportion of those nutrients (particularly starch) are turned into energy by livestock. Selling U.S. corn just by weight without taking into consideration the difference in livestock performance result of germplasm improvements puts U.S. corn at a trade disadvantage. If U.S. corn is going to be able to compete with that from other origins (i.e. Argentina, Brazil, Black Sea region), there is a need to stress its unique composition compared to that of other world regions.