Written collaboratively by Pete Bauman, Karla Hernandez and Sandy Smart.
In article three of this series, we presented two case studies on fertilization of native grasslands from McPherson County and a cooperative project from Deuel, Grant and Clark Counties. In this article we highlight a third native pasture case study from Hamlin County.
Case Study Three: Thomas and Poinsett Area, Hamlin County
2005–2006 Northeast South Dakota Pasture Fertilization Trials
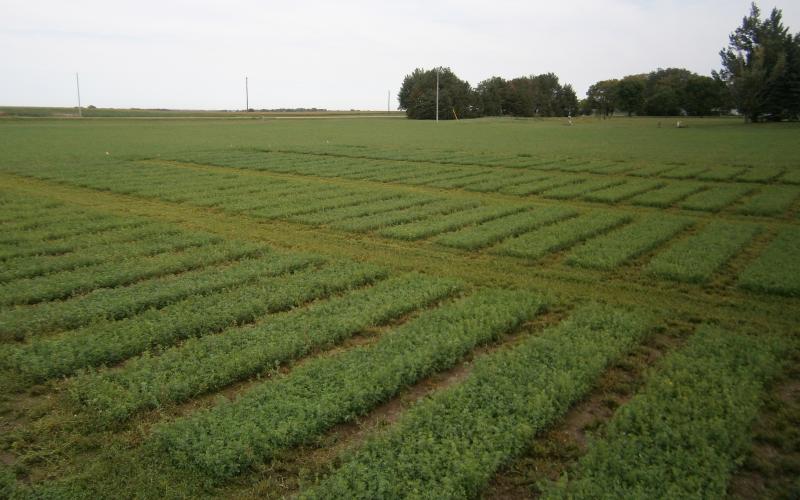
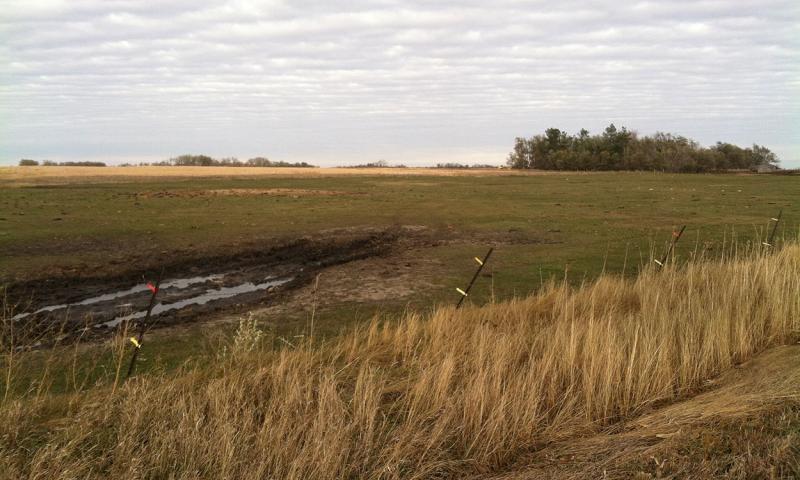
Range Science faculty at South Dakota State University (SDSU) Extension in cooperation with the U.S. Department of Agriculture Natural Resources Conservation Service (USDA NRCS) and private landowners initiated this study in Hamlin County, South Dakota in 2005 to investigate the effects of nitrogen (N) application on pasture sites. At Site 1 near Thomas, South Dakota, the pasture had never been tilled, however the portion of the pasture included in the study had shifted from a native grass-dominated community to one where introduced smooth bromegrass and Kentucky bluegrass were the predominant species. The site was managed with rotational grazing, in good-to-excellent condition, and it had an average of six inches of residue left from the previous grazing season managed with rotational grazing. Site 2, located in the Lake Poinsett area was also native rangeland. Although this site had never been farmed, it was dominated by introduced Kentucky bluegrass and smooth bromegrass and native green needlegrass. Site 2 was managed with continuous grazing, in poor-to-fair condition, and it had only two inches of residue left from the previous year.
Investigators applied four levels of N fertilization: control (0 N) and treatments of 45, 90 and 135 pounds/acre N. Three clipping treatments were applied to simulate various grazing scenarios. Forage production was estimated using a 0.96 ft2 circular frame with clipped samples weighed to the nearest gram, then dried in a forced-air oven to determine dry matter yield. Preliminary soil N tests were conducted with a 24-inch nitrate N soil test conducted at the SDSU soil lab. Investigators were able to anticipate an increase in forage production at both sites based on initial soil tests.
Forage production improved at both sites, with increases at Site 1 higher than those at Site 2. Investigators speculated this was likely due to the differences in species composition and past management history. Smooth bromegrass dominated Site 1, which had been grazed moderately over the previous several years. Smooth bromegrass, an introduced cool-season species, has been shown to respond favorably to N. At Site 2, the dominant species was Kentucky bluegrass with lesser amounts of smooth bromegrass and green needlegrass. Site 2 had been grazed heavily over the previous several years. Therefore, the potential of Site 2 to respond to increasing levels of fertilizer was likely limited to the presence of less-productive species with lower vigor.
Pre-treatment soil N and phosphorus (P) levels were low according to SDSU Extension recommendations. Nitrogen levels were eight pounds/acre at Site 1 and 13 pounds/acre at Site 2. Soil P levels were three parts per million (ppm) at both sites. The soil samples at the end of the growing season revealed that the N applied was used by the growing forage or lost to the system. Post-treatment soil N ranged from nine to 10 pounds/acre at Site 1 and from six to seven pounds/acre at Site 2. Post-treatment soil P ranged from five to 11 ppm and appeared to have carried over since the baseline level was three ppm at Site 1. Soil P was unchanged at Site 2.
Therefore, N use efficiency, as calculated by pounds of forage dry matter divided by pounds of N applied was greater for Site 1. Nitrogen use efficiency was greatest (52 pounds/acre of forage per one pound of N applied) at the 90-9-9 level, and lowest (29 pounds/acre of forage per one pounds of N applied) at Site 1 at the 135-14-14 level. At Site 2, N use efficiency was greatest (20 pounds/acre of forage per one pound of N applied) at the 135-14-14 level, and lowest (seven pounds/acre of forage per one pound of N applied) at the 45-5-5 level. Inefficiency in N use at Site 2 was likely related to the inherently lower-producing species. If grasses are over utilized, their root system may be smaller and less able to take up nutrients. This poses a possible problem with N being lost through volatilization or leaching through the soil profile below the rooting zone.
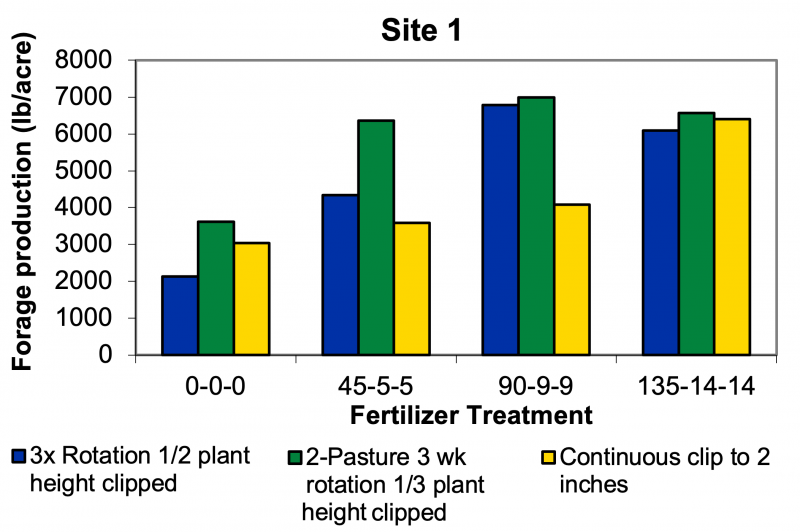
This study illustrates that site potential is very important in considering management decisions, such as fertilizing or grazing strategies. The lack of response to heavy simulated grazing management at Site 2 suggests that species, such as Kentucky bluegrass, can handle frequent, heavy defoliation. Implementing a rotational grazing strategy at Site 2 will not necessarily improve forage production, because Kentucky bluegrass may not have the yield potential (Figure 1). However, a higher-producing site, like Site 1, which is dominated by smooth bromegrass has a greater potential to increase forage production when fertilizer is added and a rotational grazing strategy is used.
The main purpose of this study was to see if fertilizing pastures paid. The spring 2005 quote from the Hayti Farmers Cooperative for 46-0-0 fertilizer was $325 a ton with an application fee of $4/acre. If 45 pounds/acre of N were applied, the cost would be $16/acre, for 90 pounds/acre of N, the cost is $32/acre and for 135 pounds/acre of N, the cost would be $47/acre. At today’s prices, 46-0-0 fertilizer costs $455/ton ($0.49/pound) and would have costs $22 for 45 pounds/acre, $44 for 90 pounds/acre and $66 for 135 pounds/acre of N for x, y and z, respectively.
At Site 1, baseline yield with no fertilizer ranged from 2,000 to nearly 4,000 pounds/acre depending on the grazing strategy. At 90 pounds of N/acre, yields ranged from about 2,000 to 2,500 pounds/acre. At the extreme, yield increased by approximately 3,500 pounds/acre under the two-pasture, three-week rotation system. At today’s rates of $44/acre for 90 pounds/acre N, that maximum additional forage was produced at a cost of approximately $25/ton.
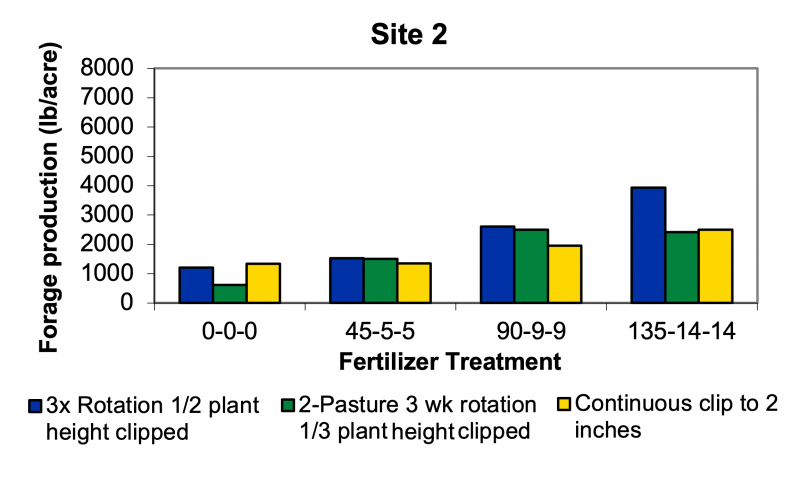
At Site 2, baseline yield with no fertilizer ranged from about 500 to 1,000 pounds/acre, depending on grazing strategy. At 90 pounds N/acre, yield ranged from 4,000 to nearly 7,000 pounds/acre. At the extreme, yield increased by approximately 2,000 pounds/acre under the two-pasture, three-week rotation system. At today’s rates of $44/acre for 90 pounds/acre N, that maximum additional forage yield was produced at a cost of approximately $44/ton.
Whether fertilization pays or not depends on the species present, the past management history and the type of grazing strategy. This study compared two very different plant communities that both were representative of typical pastures and management schemes in this area. Investigators recommended producers evaluate what type of species are present in their pastures and determine if the residue left at the end of the grazing season represents utilization levels in the “take-half, leave-half” ball park. Nitrogen fertilizer can be applied in the 90 pounds/acre range on sites with high-yielding potential species, such as smooth bromegrass, and give potentially high economic returns (Site 1). However, caution must be taken, as such additions of N may permanently alter the plant community towards favoring these species, while diminishing community resiliency when environmental factors, such as drought, are unfavorable.
Reference: Smart, Smith, Lentz and Woods. 2005-2006. Unpublished data.
Resources and References:
- Nutrient Network: Includes links to several articles on the topic.
- Alpert, P., E. Bone, and C. Holzapfel. 2000. Invasiveness, invisibility and the role of environmental stress in the spread of non-native plants. Perspectives in plant ecology, evolution, and systematics. 3:52-66.
- Borer, E.T., E.W. Seabloom, D.S. Gruner, W.S. Harpole, H. Hillebrand4, E.M. Lind1, P.B. Adler, J. Alberti, T.M. Anderson, J.D. Bakker, L. Biederman, D. Blumenthal, C.S. Brown, L.A. Brudvig, Y.M. Buckley, M. Cadotte, C. Chu, E.E. Cleland. M.J. Crawley, P. Daleo, E.I. Damschen, K.F. Davies, N.M. DeCrappeo, G. Du, J. Firn, Y. Hautier, R.W. Heckman, A. Hector, J. HilleRisLambers, O. Iribarne, J.A. Klein, J.M. H. Knops., K.J. La Pierre, A.D.B. Leakey, W. Li, A.S. MacDougall, R.L. McCulley, B.A. Melbourne, C.E. Mitchell, J.L. Moore, B. Mortensen, L.R. O’Halloran, J.L. Orrock, J. Pascual, S.M. Prober, D.A. Pyke, A.C. Risch, M. Schuetz, M.D. Smith, C.J. Stevens, L.L. Sullivan, R.J.Williams, P.D. Wragg, J.P. Wright, and L.H. Yang. 2014. Herbivores and nutrients control grassland plant diversity via light limitation. Nature. 00:1-4.
- Dickson, T.L. and B.L. Foster. 2011. Fertilization decreases plant biodiversity even when light is not limiting. Ecology Letters. 14:380-388.
- Foster, B.L., and K.L. Gross. 1998. Species richness in a successional grassland: effects of nitrogen enrichment and plant litter. Ecology. 79:2593-2602.
- Gerwing, J., A. Bly, L. Butler, D. Curtis, and G. Erickson. 2004. Fertilizer N and P influence on pasture yield in McPherson County SD in 2004 (projects 35004 and 35104). Soil/water research. South Dakota State University. 2004 progress report. Agriculture Experiment Station. Plant Science Department. Soil PR 04-7:1-3.
- Harpole, W.S., and D. Tilman. 2007. Grassland species loss resulting from reduced niche dimension. Nature. 446:791-793.
- Hautier, Y., P.A. Niklaus, and A. Hector. Competition for light causes plant biodiversity loss after eutrophication. 2009. Science. 324:636-638.
- Hautier, Y., E.W. Seabloom, E.T. Borer, P.B. Adler, W.S. Harpole, H. Hillebrand, E.M. Lind, A.S. MacDougall, C.J. Stevens, J.D. Bakker, Y.M. Buckley, C. Chu, S.L. Collins, P. Daleo, E.I. Damschen, K.F. Davies, P.A. Fay, J. Firn, D.S. Gruner, V.L. Jin, J.A. Klein, J.M.N. Knops, K.J. La Pierre, W. Li, R.L. McCulley, B.A. Melbourne, J.L. Moore, L.R. O’Halloran, S.M. Prober, A.C. Risch, M. Sankaran, M. Schuetz, and A. Hector. 2014. Eutrophication weakens stabilizing effects of diversity in natural grasslands. Nature. 508:521-525.
- Hector, A., Y. Hautier, P. Saner, L. Wacker, R. Bagchi, J. Joshi, M. Scherer-Lorenzen, E. M. Spehn, E. Bazeley-White, M. Weilenmann, M. C. Caldeira, P. G. Dimitrakopoulos, J. A. Finn, K. Huss-Danell, A. Jumpponen, C. P. H. Mulder, C. Palmborg, J. S. Pereira, A. S. D. Siamantziouras, A. C. Terry, A. Y. Troumbis, B. Schmid, and M. Loreau. 2010. General stabilizing effects of plant diversity on grassland productivity through population asynchrony and overyielding. Ecology. 91:2213-2220.
- Lamb, E.G. 2008. Direct and indirect control of grassland community structure by litter, resources, and biomass. Ecology. 89:216-225.
- Seabloom, E. W., C.D. Benfield, E.T. Borer, A.G. Stanley, T.N. Kaye, P.W. Dunwiddie. 2011. Provenance, life span, and phylogeny do not affect grass species' responses to nitrogen and phosphorus. Ecological Applications. 21:2129-2142.
- Silvertown, J.P, P. Poulton, E. Johnston, G. Edwards, M. Heard, and P.M. Bliss. 2006. The Park Grass Experiment 1856-2006: Its contribution to ecology. Journal of Ecology. 94:801-814.
- Stevens, C.J., N.B. Dise, J.O. Mountford, and D.J. Gowing. 2004. Impact of nitrogen deposition on the species richness of grasslands. Science. 303:1876-1879.