Written by Jack Davis, former SDSU Extension Crops Business Management Field Specialist.
Background

Working capital is calculated by subtracting current liabilities from current assets. Current assets include cash, accounts receivable, market livestock and grain inventories, prepaid expenses and current growing crop. Current liabilities include accounts payable, unpaid taxes, accrued expenses, (i.e. interest), balance on operating line of credit, and principal payments that are due within the year on longterm notes.
Working capital provides a first line of defense for financial stress and an opportunity to take advantage of bargains that may arise. A strong working capital position allows the business to survive financial downturns that may weaken the farm’s capacity to service debt payments, purchase inputs, or complete current plans. It also affords the ability to take advantage of opportunities that may develop (i.e. expansion, pre-pay discounts, add additional resources).
Working Capital Targets
How much working capital is needed? When there is a volatile business climate, variability of net returns, and large size, a greater working capital amount is needed. A target or benchmark that measures working capital in relation to gross revenue or total expenses works well for monitoring and managing working capital. The formula is (Current Assets - Current Liabilities) ÷ Gross Revenue. A strong target is a working capital to gross revenue above 0.35. This level of working capital provides the safety net to weather a one or two-year downturn. If working capital falls below 0.20, the farm may have trouble repaying loans.
"A strong working capital position allows the business to survive financial downturns that may weaken the farm’s capacity to service debt payments, purchase inputs, or complete current plans."
Trends in Working Capital
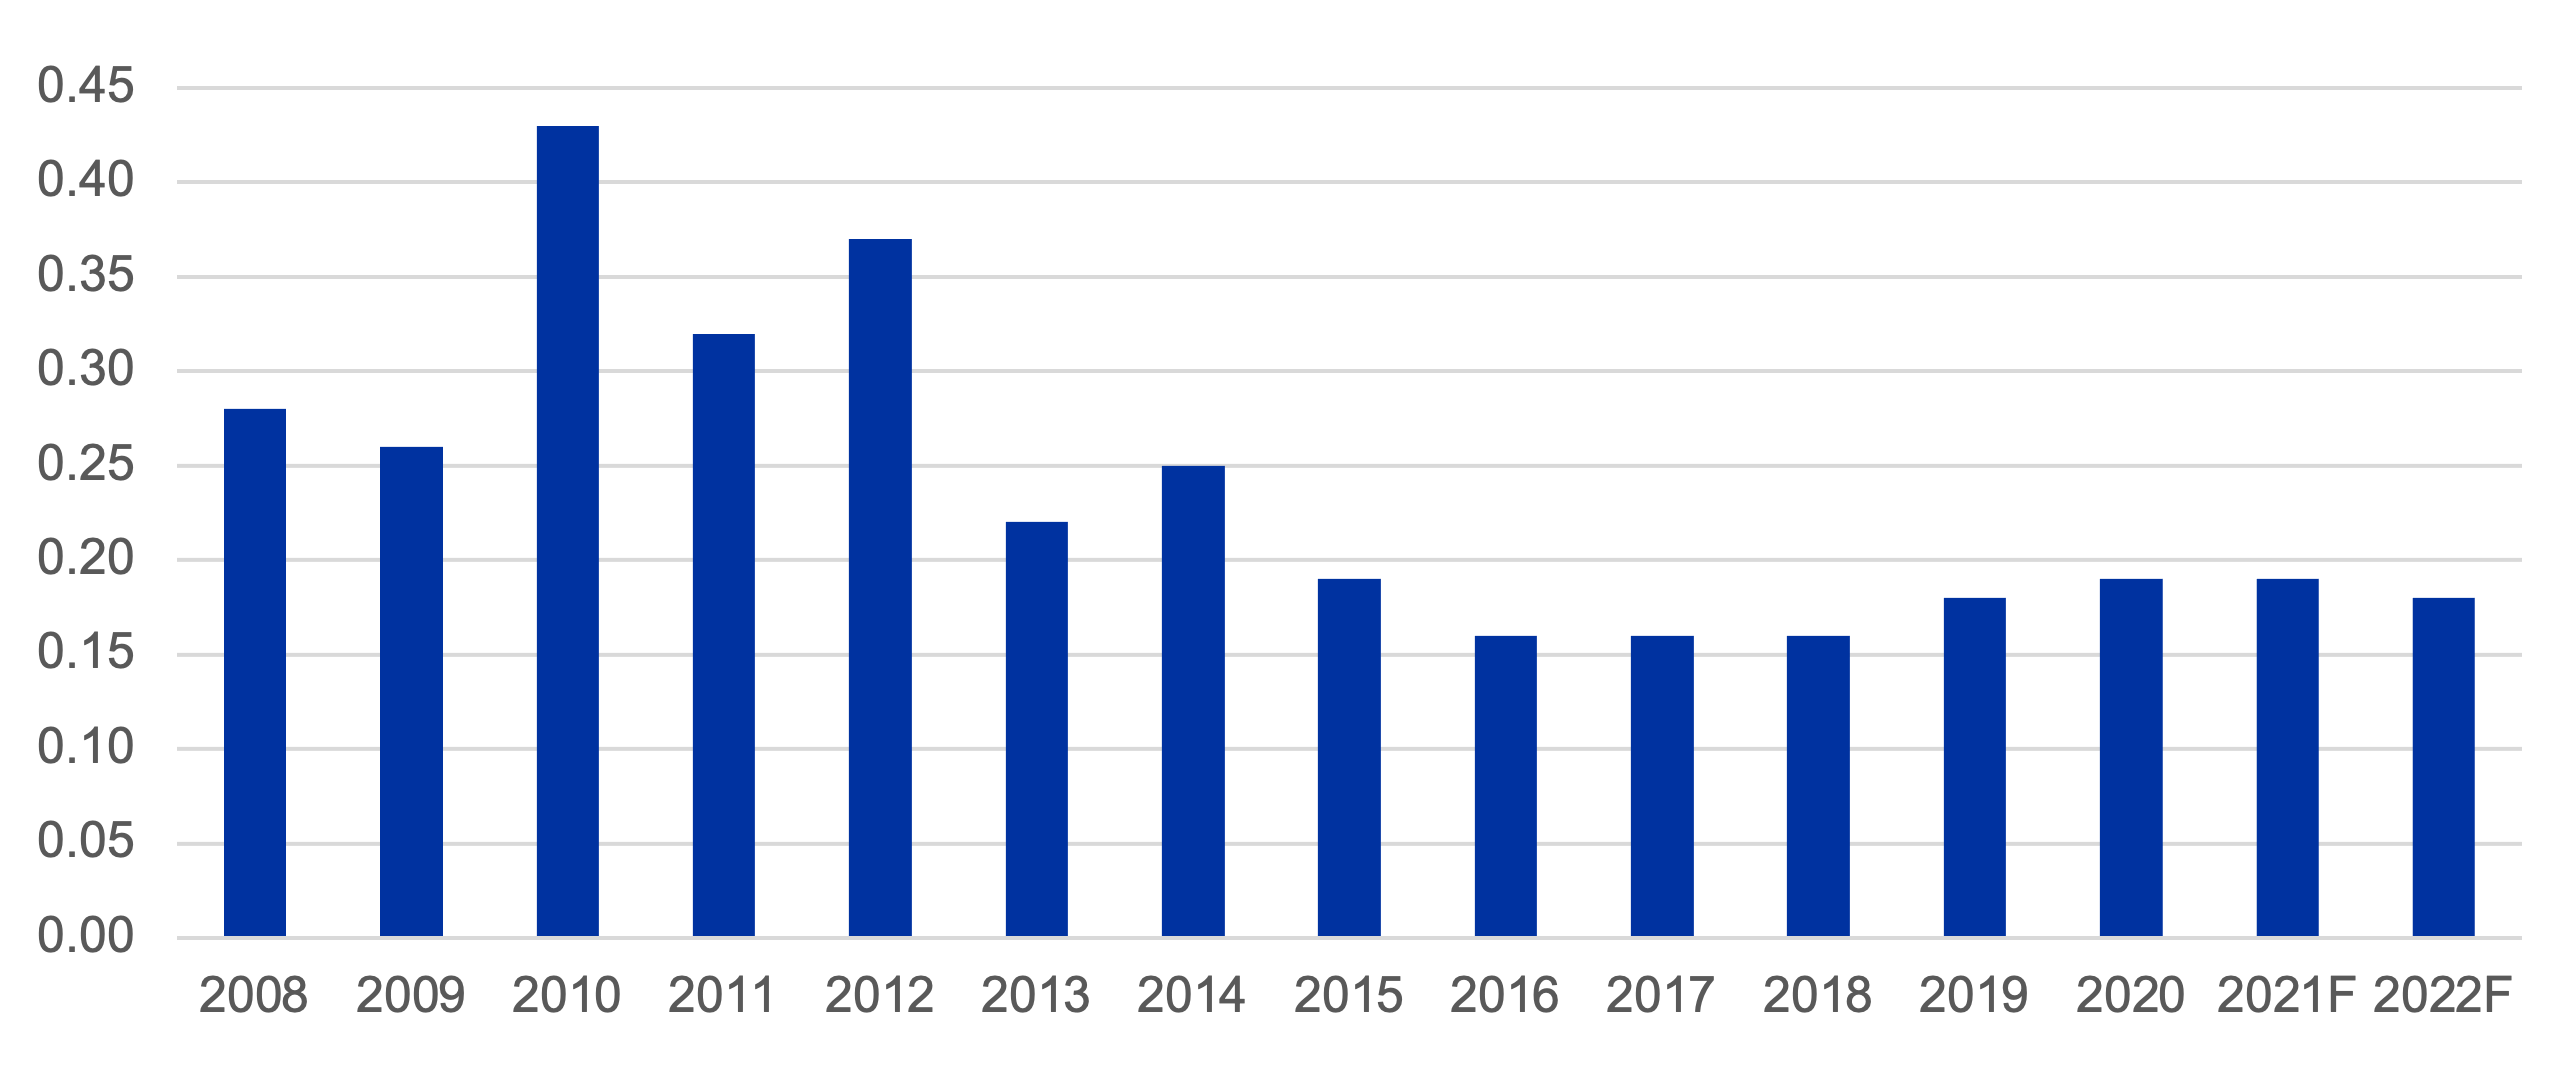
Figure 1 illustrates the trend in working capital to gross revenue for U.S. farms since 2008. The ratio was above the target 0.35 in 2010 and 2012. Recently, the ratio has been below 0.20. The 2022 projected ratio is 0.18, showing that some farms may be having trouble repaying loans.
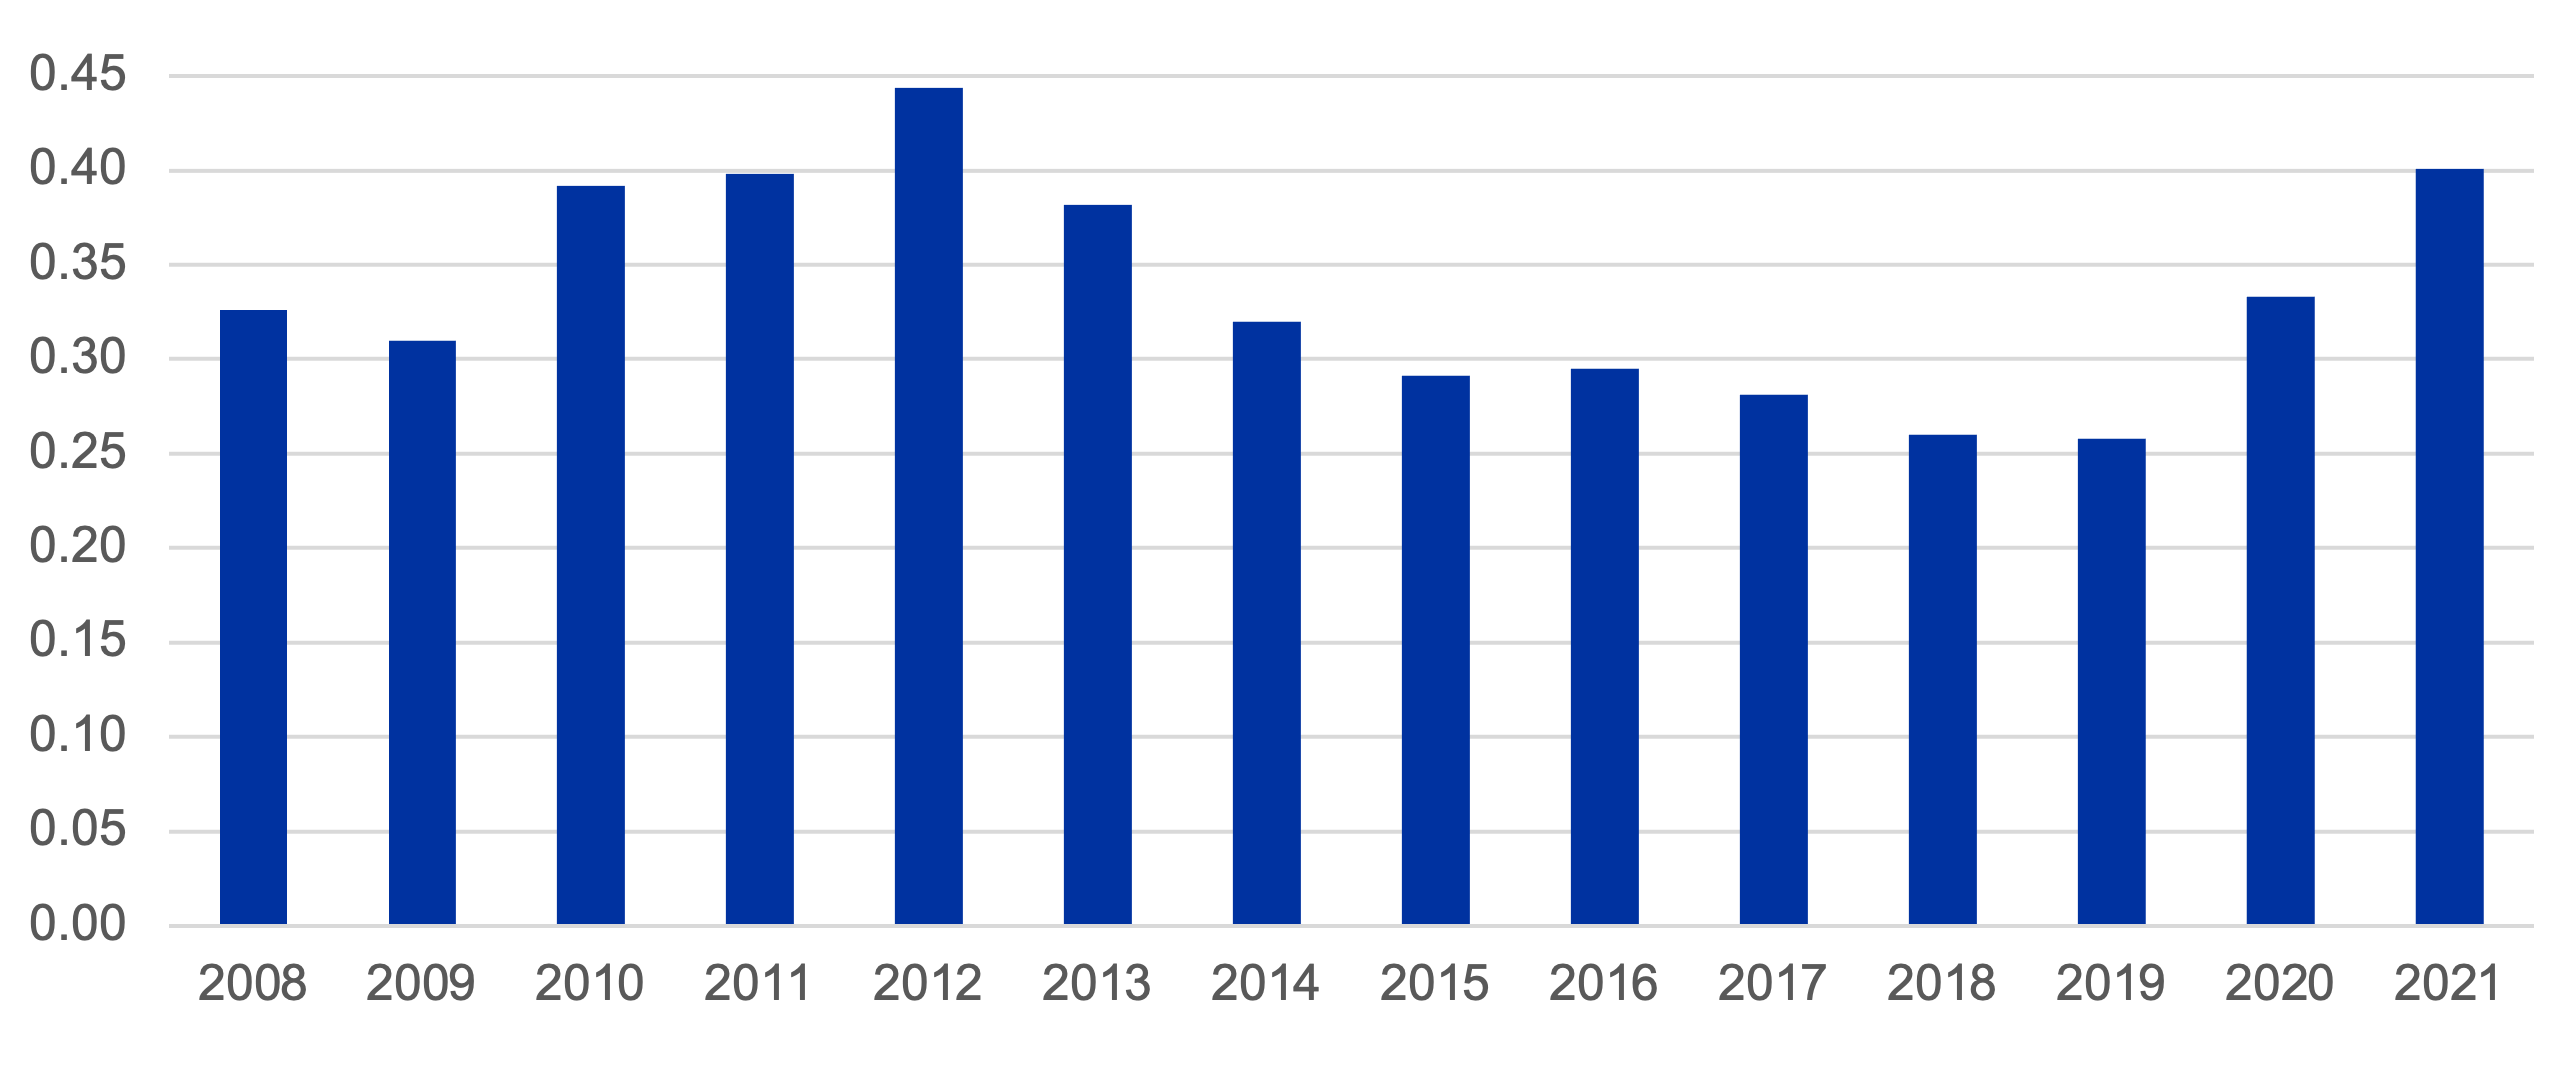
The Center for Farm Financial Management at the University of Minnesota summarizes data in FINBIN and can be queried on a regional and farm-type basis. Farm’s average working capital to gross revenue in the four-state region (South Dakota, North Dakota, Nebraska, Minnesota, Figure 2) remained above 0.30 from 2008 to 2014, reaching a peak of 0.44 in 2012 before dipping below 0.30 at 0.29 in 2015. The ratio reached its low at 0.26 in 2018 and 2019 ahead of rising to 0.40 in 2021. The farms participating in FINBIN data base in the four-state region have maintained an average working capital to gross revenue above the values presented from USDA and, on average, are in a stronger liquidity position than the national statistics.
Conclusions
Although there was an improved net farm income in 2021, there are still farms with a fragile liquidity position in the region (working capital to gross revenue ratio below 0.20). These farms may experience a difficult financial situation as interest rates increase (See our latest Ag Economic Dialogues video), including strain in respect to obtaining inputs, timing of sales, tough to borrow funds to replace machinery, or acquire other assets. These farms will have to carefully monitor and control cash flows.
Reference
- FINBIN (2022). Center for Farm Financial Management: University of Minnesota. Retrieved from http://finbin.umn.edu (originally created July 18 2022)