Written collaboratively by Tong Wang and Wajdi Belgacem.
Background
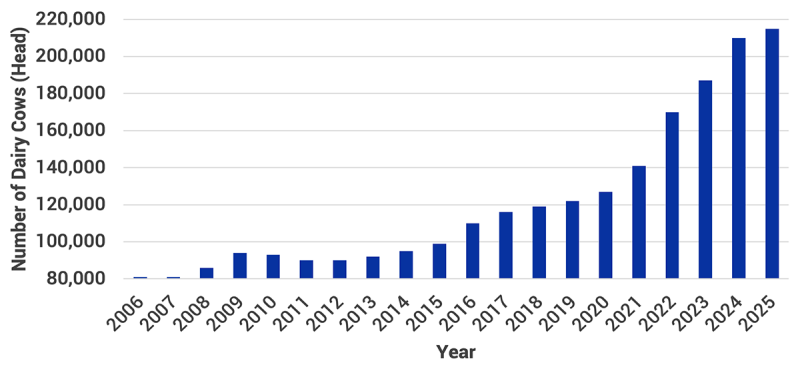
Over the past 20 years, the number of dairy cattle in South Dakota has increased exponentially, from slightly over eighty thousand in 2006 to over two hundred thousand in 2025.
According to the U.S. Department of Agriculture (USDA) National Agricultural Statistics Service (NASS) Cattle Survey (Figure 1), the increasing trend becomes more apparent after 2015, and the increase accelerated after 2020.
Dairy Production More Concentrated in Eastern South Dakota
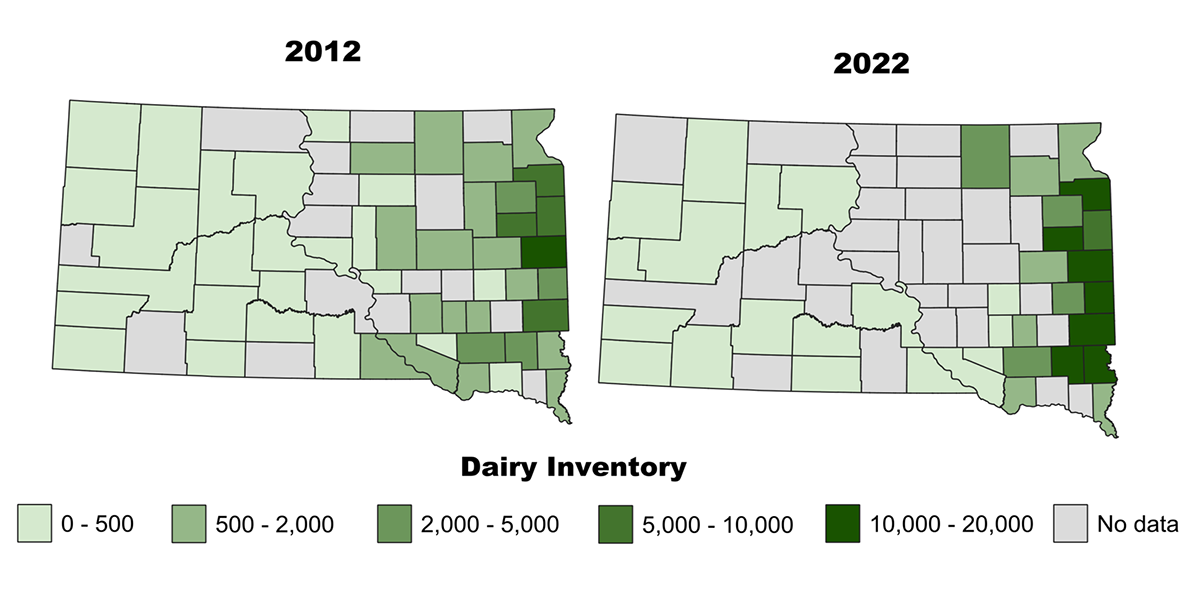
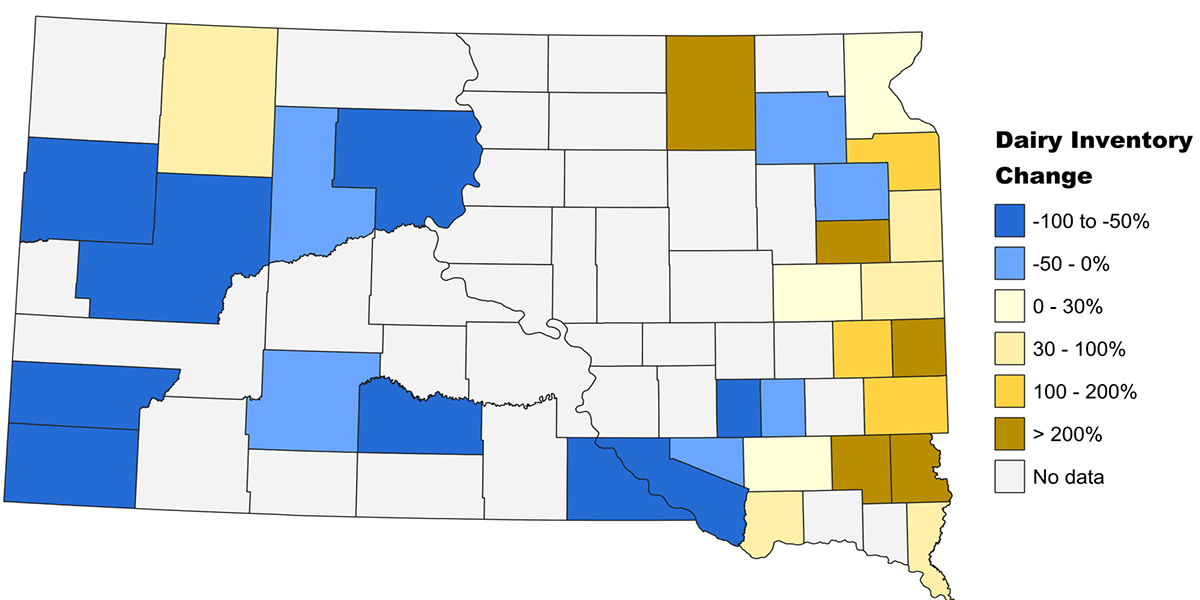
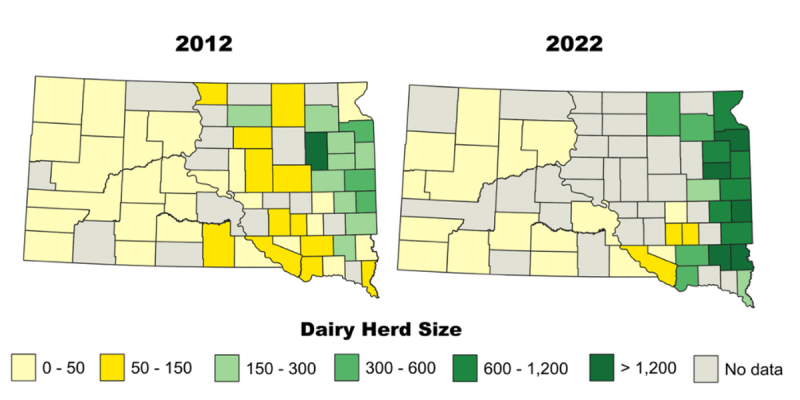
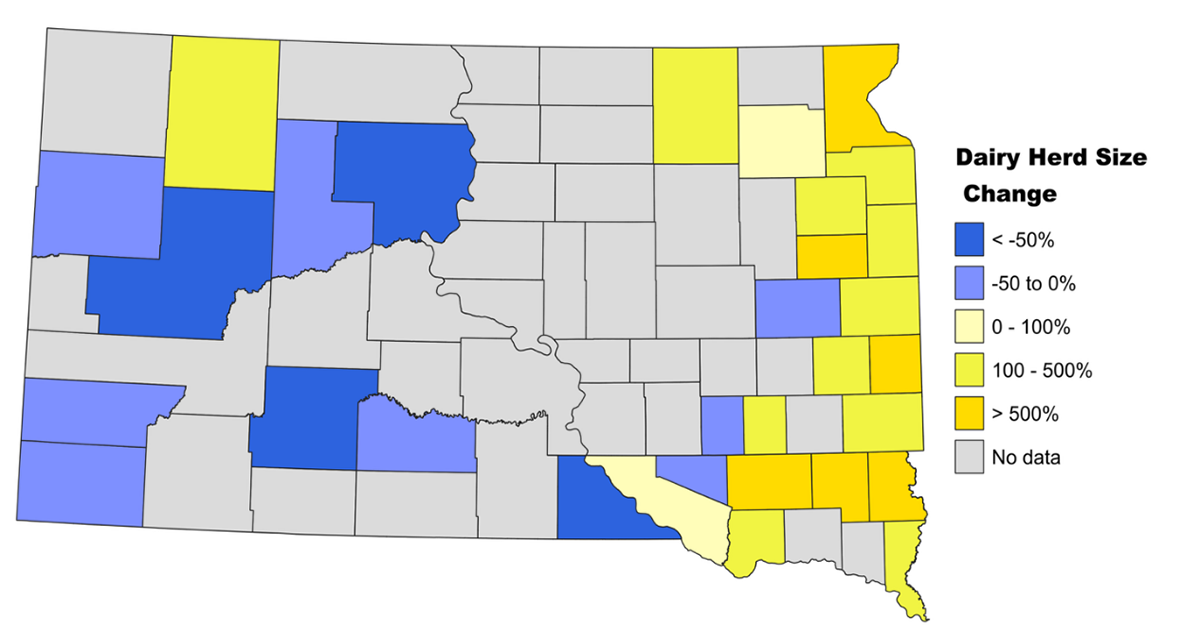
The USDA Agricultural Census further revealed that dairy production at the county level varies greatly across South Dakota. Specifically, we can see that dairy cows are mostly concentrated on the East border of the state, and such concentration becomes more apparent over 2012-2022 (Figure 2). As illustrated by Figure 3, we can see between 2012 and 2022, all the counties located on or close to the east border of the state have experienced an increase in dairy cattle numbers, yet the dairy inventory has decreased for almost all the Western South Dakota counties.
The increase in concentration can also be reflected by the share of the top dairy production counties out of the state. As of 2022, the top ranked 10 counties in terms of dairy cow number, listed by order, are: Brookings, Minnehaha, Grant, Hamlin, Moody, Turner, Lincoln, Deuel, Lake and McCook, all located in Eastern South Dakota. Together, these top 10 counties had 82% of the dairy cows in the state, with top 5 counties alone taking up 56% of the total. These numbers suggested more visible concentration nowadays than a decade ago, when the dairy cattle share was 67% for the top 10 counties and 46% for the top 10 counties (Table 1).
| Dairy Cattle Share | 2012 | 2022 |
| Top 5 counties | 46% | 56% |
| Top 10 counties | 67% | 82% |
Difference in Dairy Production Systems Across State
Other than differences in total dairy inventory, the average dairy herd sizes also vary dramatically across East and West South Dakota. While west river counties have on average less than 50 cattle per operation, it is almost become the norm for the counties along the east border of South Dakota to have over 1,000 dairy cattle per operation (Figure 4). This vast difference in herd size could reflect the difference in dairy production methods. While the dairy cattle in the west are likely to be raised in an extensive or grazing system, dairy operations in Eastern South Dakota are mostly using under intensive production system which relies on specialized feed, advanced technology on relatively small land areas.
Consolidation of Dairy Farms
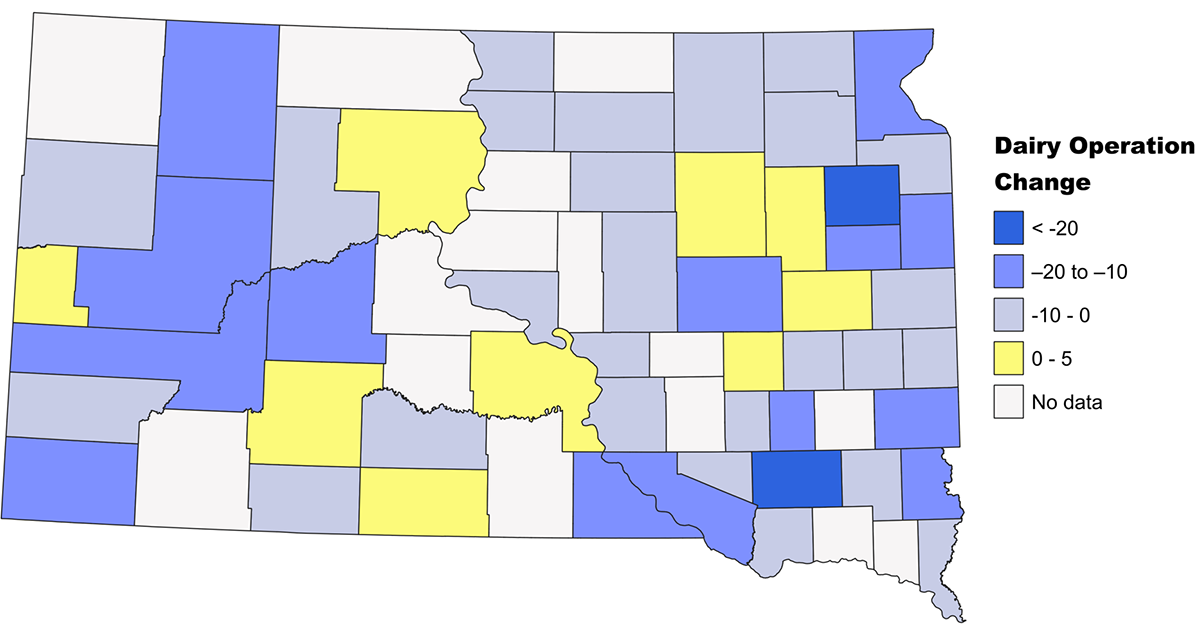
Across the state, we can see large reductions in dairy cow operations for almost every county over the past decade, except for a few counties that have only minor increase in operation numbers (Figure 5). The reduction in dairy operation in tandem with the increase in dairy inventory indicates the consolidation of dairy operations (Figure 6). Such change could be due to the economies of scale and technological innovations in recent decades. As the small-scale diary operations on extensive systems are gradually exiting, while the large operations have increased dramatically, the intensive system has become the predominant system in dairy production.
In Summary
In summary, we see continued growth in dairy production in South Dakota over the past two decades, with such growth more concentrated in East South Dakota and large dairy operations. This indicates a trend of consolidation with large farms in concentrated regions producing an increasing share of dairy products.
Reference
United States Department of Agriculture, National Agricultural Statistics Service. (n.d.). Quick Stats. U.S. Department of Agriculture.