Written collaboratively by Dinithi Malaviarachchi, Emelia Acheampong, Matthew Diersen, and Sarah Sellars.
Introduction

Producers in South Dakota use Margin Protection (MP) crop insurance to manage production risk. One aspect of MP that is unique is that it allows the producers to insure against rising input costs, in theory, but more research is needed to understand how farmers are utilizing MP insurance. The MP crop insurance program was introduced as a federal risk management tool, allowing producers to safeguard their operating margins rather than just yields or revenue.
MP crop insurance emerged as a "third generation" crop insurance product, building on the foundations of Yield Protection (YP) and Revenue Protection (RP). It was initially proposed in 2007 and piloted in 2016 for corn and soybeans in Iowa. It then expanded throughout the Midwest in 2018 (USDA RMA, 2018). MP is designed to manage the risk of revenue declines and input cost spikes, making it particularly valuable during periods of economic instability or during supply chain disruptions (USDA RMA, 2022). Further research will investigate whether MP is effective at mitigating input cost spikes.
The annual deadline for the purchase of Margin Protection (MP) insurance for producers in South Dakota and neighboring states is September 30th. This article provides a framework for evaluating tradeoffs, analyzing key factors such as projected input costs and coverage levels to inform a strategic coverage selection before the deadline. It investigates the adoption of Margin Protection (MP) crop insurance in South Dakota on corn and soybean acres and evaluates whether neighboring states exhibit similar trends in MP enrollment.
Background
Margin Protection (MP) is an area-based crop insurance product under the USDA’s Multiple Peril Crop Insurance (MPCI) program. In South Dakota, MP is most purchased with the Harvest Price Option (MP-HPO) as an endorsement to the farmer’s underlying policy instead of as a stand-alone policy (USDA RMA,2024). When combined with a base policy, a premium credit is applied to account for any potential overlaps in indemnity payments between the two policies. MP provides coverage against an unexpected drop in operating margin, defined as the difference between the revenue and the input costs.
Margin = Revenue - Input Costs
Potential margin losses may arise due to increases in key input costs, declines in commodity futures prices, lower county-level yields, or any combination of these risk factors. An indemnity payment is triggered when the harvest margin for a county fall below the trigger margin. The amount paid as indemnity depends on the expected revenue, the actual harvest prices and the yield and the chosen coverage level.
Trigger Margin = Expected Margin - [Expected Revenue × (1 - Coverage Level)]
Harvest Margin = Actual harvest revenue - Actual harvest cost
MP offers broader coverage than other shallow-loss options, contributing to its popularity in South Dakota and neighboring states. Coverage levels range from 70% to 95%, with higher levels providing more protection but also higher premium costs. Federal subsidies range from 59% at the 70% coverage level to 44% at the 95% coverage level. Producers may also choose the Harvest Price Option (HPO), which increases the trigger margin if the harvest price exceeds the projected price, providing additional protection in rising markets.
The most critical determinant of margin variability under MP is the treatment of input costs which also distinguishes MP from other crop insurance policies. MP classifies inputs into two categories: those with fixed prices and those with variable prices. Fixed inputs such as seed, machinery, and general operating expenses are assumed to remain constant throughout the growing season. In contrast, variable inputs, which are explicitly listed in the MP policy provisions, are subject to market price fluctuations and are used to adjust the expected input cost component of the margin. For example, in the case of corn, variable inputs typically include diesel fuel, urea, diammonium phosphate (DAP), potash, and interest rates (USDA RMA, 2023).
Findings
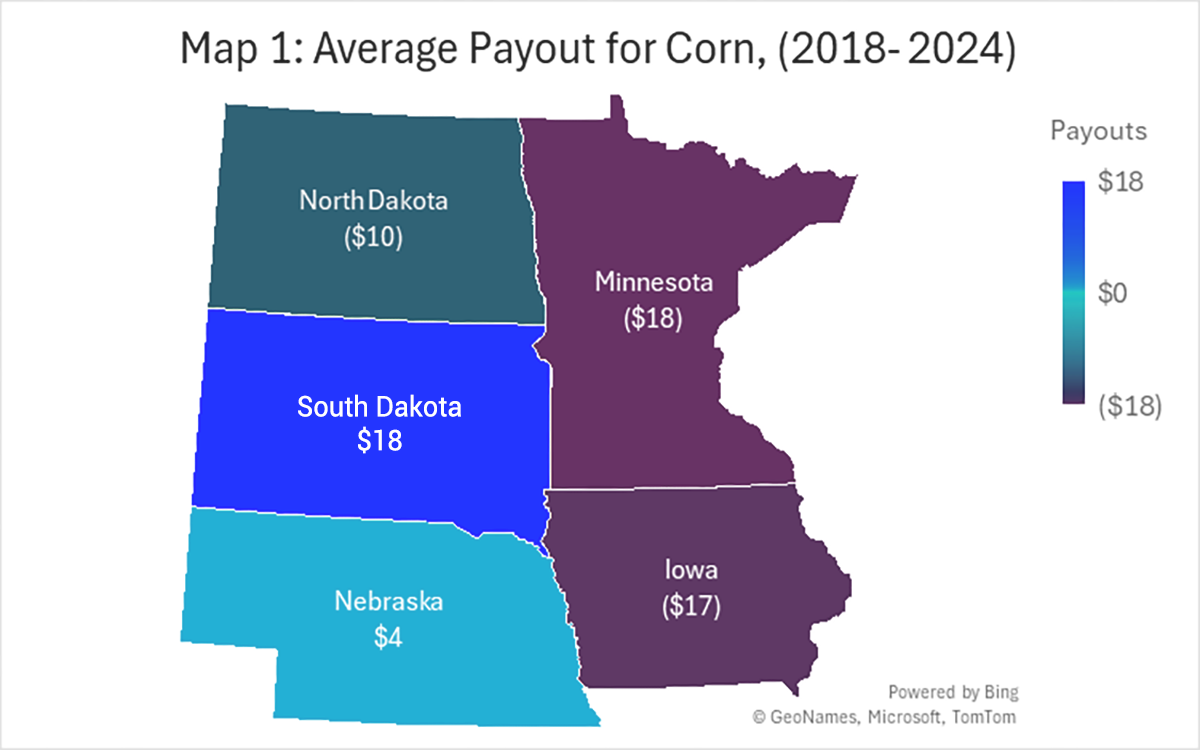
Figure 1 shows the average corn payout (indemnity - (total premium-subsidy))/endorsed acres in the region. If the number is positive, it means the indemnity was greater than the premium paid, and if the number is negative, the indemnity is smaller than the premium paid. The two states with positive payouts are South Dakota and Nebraska. This implies that market conditions in South Dakota (and Nebraska) caused margin losses that MP effectively covered, highlighting that MP's effectiveness varies significantly by geography. Whether those losses are driven by the revenue or the cost side of the MP equation is a question for further analysis.
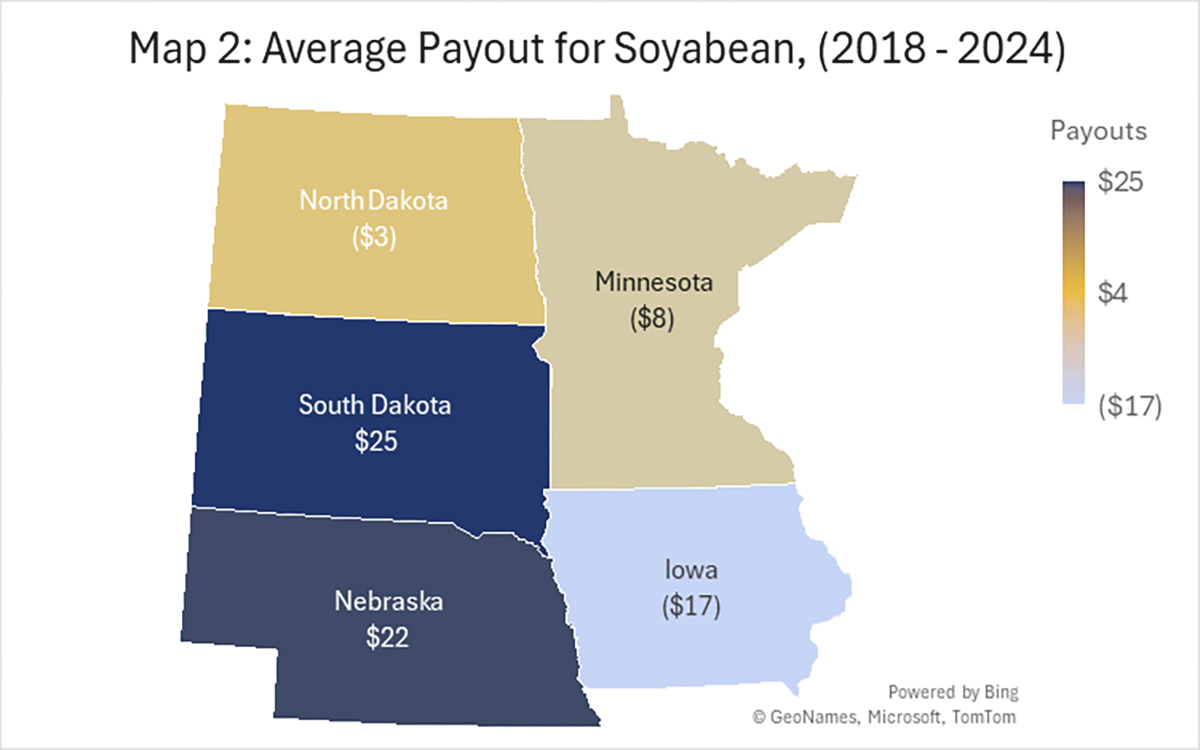
Figure 2 shows the average payout for soybeans in the region in 2022. While the averages are lower for soybeans than corn, the two states that again have a positive payout are South Dakota and Nebraska.
Variation in Payouts
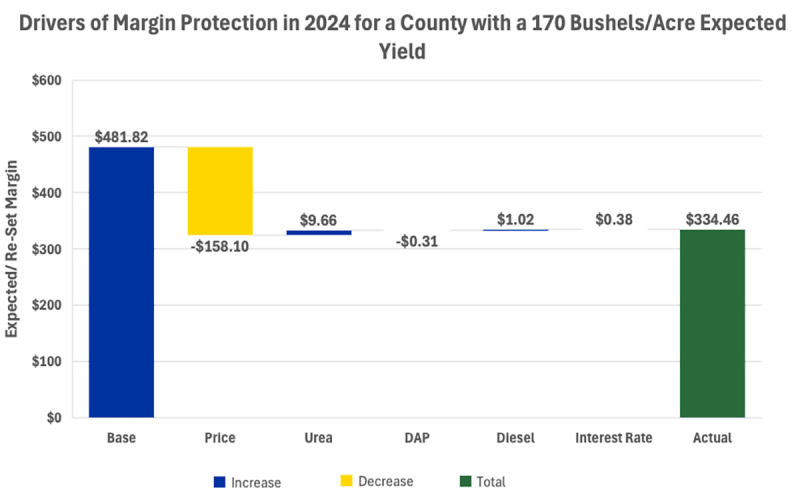
MP payouts vary significantly across production years due to the complex interplay of market price movements, fluctuations in key input costs such as fertilizer and diesel, and yield performances. As commodity markets experience price surges or downturns, and input costs fluctuate sharply, the actual margins realized by producers can deviate substantially from the expected margins (Figure 3).
Figure 3 illustrates the key drivers of MP for a county with an average expected corn yield of 170 bushels per acre in 2024. While both commodity prices and input costs influence margins, price changes emerge as the dominant driver, causing the largest shifts from the base margin. In comparison, fluctuations in input costs have minor impacts on the margins, but urea prices stand out for their high year-to-year volatility, often tied to energy markets and global trade conditions. It is important to note that this pattern is not fixed across all years, but during periods of sharp fertilizer and fuel price spikes, input costs can have a substantial effect on payouts and in some cases rival the impact of commodity price changes. While commodity prices and input costs are set nationally and remain the same across all counties in a given year, yields vary locally. Therefore, differences in payouts across counties depend on the variations in the average county yields.
Figure 4 highlights the relationship between county-level MP net payouts for 2024 with the expected county corn yields. The size of each bubble reflects the number of acres insured under MP-HPO in each county, while colors distinguish the states. South Dakota, Nebraska, and North Dakota include a greater share of counties with moderate to lower yield expectations with higher variability in payouts. Iowa and Minnesota, by contrast, include a greater share of counties with higher yield expectations and tend to show more consistent clustering in the mid to upper payout ranges.
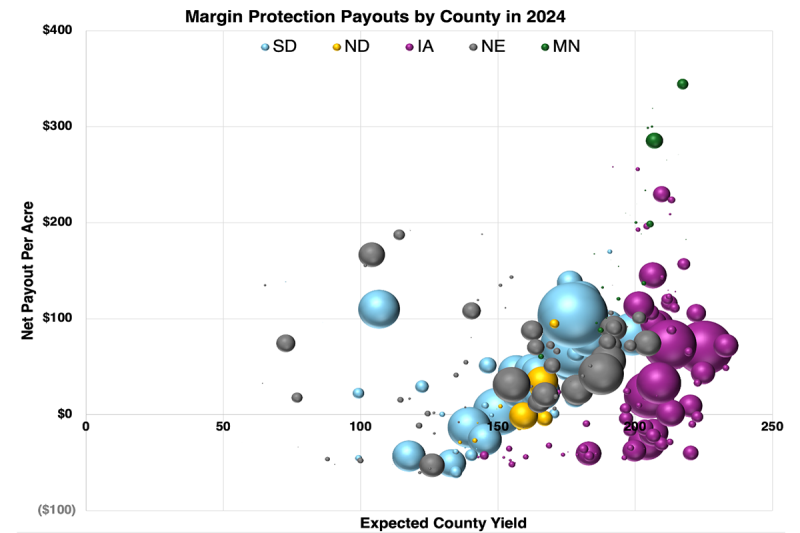
Across all states, counties with higher expected yields generally cluster within the $50–$300 per acre payout range, spanning the lower, mid, and upper categories of payouts. While higher-yielding counties often secure stronger protection under MP, net payouts still vary widely, from modest returns at the lower end ($50–$100 per acre) to substantial gains above $200 per acre. However, there are substantial variations even among counties with similar expected yield levels. Some counties recorded low or even negative net payouts because their actual yields were well above expectations, offsetting the negative impact of lower prices and higher input costs. In some cases, the MP premium exceeded the indemnity, resulting in a net loss. In contrast, counties with yields far below expectations received the highest net payouts as severe yield losses sharply reduced revenue per acre and triggered larger indemnities. Combined with falling prices and rising input costs in 2024, these yield shortfalls caused large margin declines, triggering substantial indemnities. This reveals that, even when national market conditions increase the potential for indemnities, local yield outcomes remain the primary driver of county-level MP net payouts.
Table 1 compares the average net payout for Margin Protection to other similar endorsements, which are the Enhanced Coverage Option (ECO) and Supplemental Coverage Option (SCO). Across the states, the average payouts from 2018 to 2024 show that ECO generally delivered the strongest and most consistent returns, while SCO tended to deliver only modest gains, often close to breakeven. MP results were more uneven, performing well in some areas but producing negative averages in others. However, in the most recent years, MP has performed comparatively well, as shown in the bubble chart in Figure 4. This suggests that while ECO has historically been the most reliable option, MP has shown increasing relevance under recent market and yield conditions.
| State | ECO | SCO | MP |
|---|---|---|---|
| North Dakota | $9 | $1 | $ (10) |
| South Dakota | $19 | $11 | $18 |
| Nebraska | $ 23 | $1 | $4 |
| Iowa | $ (2) | $1 | $(17) |
| Minnesota | $15 | $10 | $ (18) |
Conclusion
MP crop insurance is an endorsement/policy that is growing in popularity in South Dakota. We investigated how South Dakota MP average payouts compared to neighboring states and found that South Dakota and Nebraska averaged the highest payouts. Our analysis showed that average MP payouts were highest in South Dakota and Nebraska, while other states often recorded lower or even negative averages. ECO provided the most consistent support across states, and SCO generally delivered modest returns close to breakeven. MP outcomes were more variable over the full period, but its performance has improved eventually in recent years, helping explain its increasing adoption by producers in South Dakota. Importantly, input costs such as fertilizer and fuel costs can experience sharp price spikes, and MP’s ability to account for input cost risk makes it a valuable tool for protecting farm margins when both commodity prices and costs are volatile.
References
- U.S. Department of Agriculture, Risk Management Agency. (2016). Margin protection for corn and soybeans. U.S. Department of Agriculture, Risk Management Agency.
- U.S. Department of Agriculture, Risk Management Agency. (2022). Margin protection (MP) insurance program. U.S. Department of Agriculture.
- U.S. Department of Agriculture, Risk Management Agency. (2023). Margin protection for federal crop insurance [Fact sheet]. Retrieved August 14, 2025.
- U.S. Department of Agriculture, Risk Management Agency. (2024). Margin protection. Retrieved August 14, 2025.
- U.S. Department of Agriculture, Risk Management Agency. (2024). Summary of business report generator.
- Watts and Associates. (2023). Margin protection 2024 crop year.