Overview
Drought planning is a critical part of ranch management. A strong drought plan should have a series of critical trigger dates in which the manager evaluates climate information, forage resources, and cow nutrient demands. It is important to take initiative with this process to manage land resources and livestock before drought occurs and a situation of "too little, too late” emerges.
This article explores three free online resources to help managers evaluate information:
- Remote sensing of forage production on pastures can be estimated using the Rangeland Analysis Platform.
- Expansion of the South Dakota Mesonet service allows access to a variety of climate data across the state.
- The National Oceanic and Atmospheric Administration (abbreviated as NOAA) Climate Prediction Center provides readily available information in short-term and long-term weather forecasts.
Current Outlook
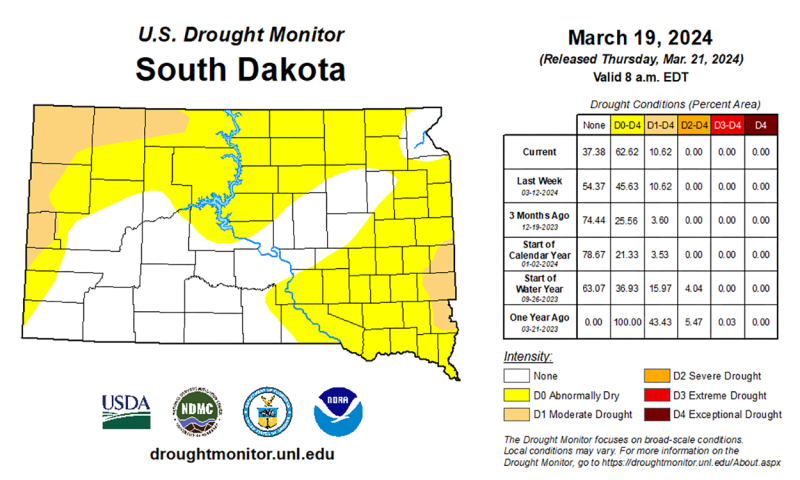
Several areas in South Dakota have received below average precipitation in the last year, and 62% of the state is abnormally dry as of March 19, 2024 (Figure 1).
April 1 is a suggested first trigger date to investigate the following questions:
- How much forage was produced during last year’s growing season?
- How much precipitation was received during last year’s growing season?
- How much precipitation was received during the fall and winter?
- How much soil moisture exists now?
- What are the rapid drought indices showing now?
- What is indicated in the Climate Prediction Center 1, 2, and 3-month outlooks?
Resource 1: Rangeland Analysis Platform’s Production Explorer
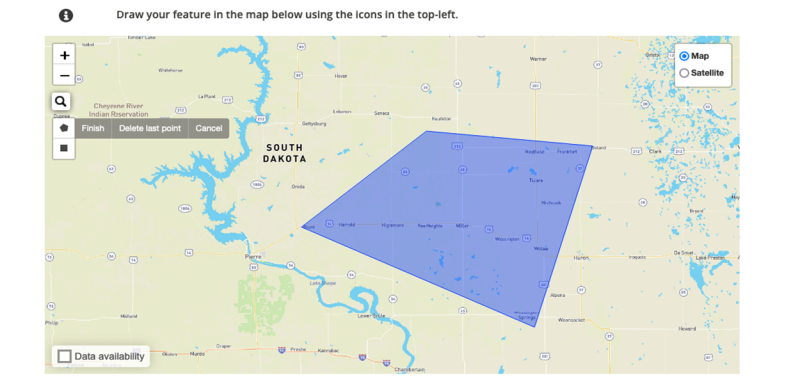
To get an estimate on how much forage was produced on your ranch last year, you can use the Rangeland Analysis Platform’s Production Explorer (abbreviated as RAP).
The user can highlight pastures on the website’s satellite maps using the ‘draw a feature’ selection. The RAP will automatically calculate the end-of-season forage production estimate for the selected years.
It will also compare current season forage production to 50%, 75%, normal, 125%, and 150% of the long-term average.
Resource 2: South Dakota Mesonet
Ag Weather Tool
Under the ‘Tools’ dropdown menu, click on the Ag Weather Tool to view a comparison of current year precipitation to the 30-year normal. Then select the location and the year you are interested in viewing. The graph displays a curve of precipitation with the 30-year normal as a solid black line and the current year’s precipitation in green. If you hover over a particular date, it will show both the current total and the normal rainfall up until that date so you can see the exact difference.
Archives Local Data
Under the ‘Archives’ dropdown menu, click on Local Data to view climate data from the past. Select the location of interest, the month/months, and a year. For example, to look at the most-recent winter data, select Dec-Jan-Feb and 2024. A variety of climate data will be displayed, with the summary in the box at the top of the page. In the summary box, it also shows the precipitation deviation (+/-) from normal.
Soil Moisture
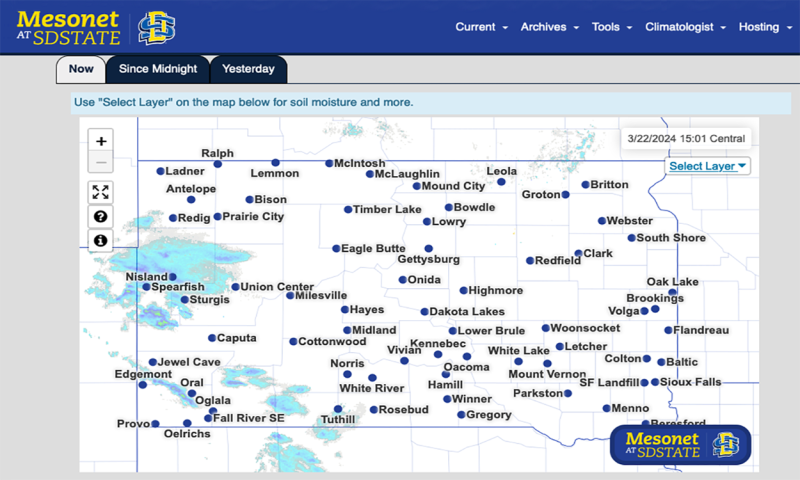
Under the ‘Archives’ dropdown menu, click on State Maps. From the ‘Select Layer’ dropdown menu on the map, select ‘soil moisture’ to view the soil moisture at various depths. The map will show stacks of five ‘poker chips’ in each location. Each chip corresponds with soil depths of 2, 4, 8, 20, and 40 inches, from top to bottom. The assorted colors refer to the inches of water per cubic inch of soil. There is a key in the box at the bottom of the map. You can also view the soil frost depth from this same page by selecting the ‘frost depth’ on the map layer. As of March 21, 2024, most of the state’s soil (aside from some areas in the northeast) has already thawed.
Drought Dashboard
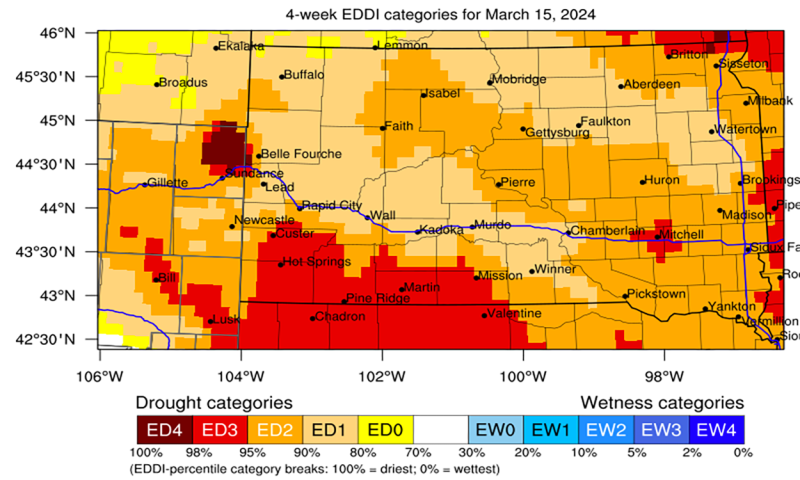
Under the ‘Climatologist’ dropdown menu, click on Drought Dashboard to view some of the latest drought monitoring tools and forecasts. On the ‘General Drought Information’ tab, the current U.S. and South Dakota drought monitors are displayed alongside the 4-week Evaporative Demand Drought Index (abbreviated as EDDI). This map is strongly influenced by both precipitation and temperature and indicates the potential for drought conditions to emerge. The EDDI ending March 15, 2024, is of note, because it shows that already thawed soils and warmer temperatures are drying out the soil (Figure 2).
Other information on the Drought Dashboard includes vegetation response maps for both cropland and rangeland, temperature and precipitation data, and an experimental estimate of soil moisture. On this soil map, the normal range is 30 to 70%, drier is less than 30% and wetter is less than 70%. Regularly monitor this dashboard for quick and easy assessment of drought conditions.
Resource 3: NOAA Climate Prediction Center
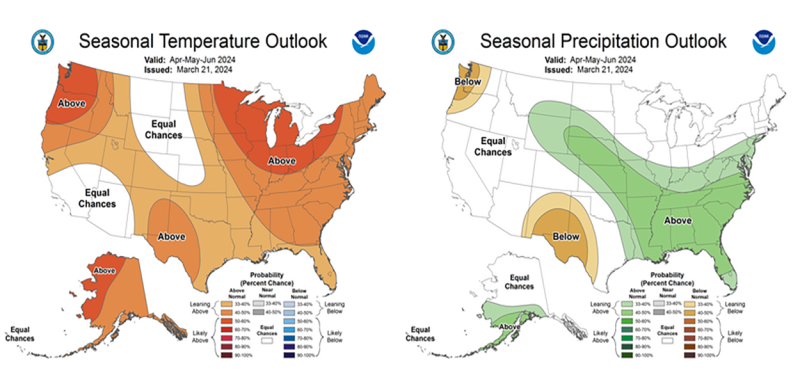
Continuing from the South Dakota Mesonet, under the Drought Dashboard page, select the ‘Forecasts/Outlooks’ tab. You can also go directly to the NOAA Climate Prediction Center. Short-term and long-term outlooks on temperature and precipitation are available. We recommend viewing the 1-month and 1-3-month (‘seasonal’) outlooks on both temperature and precipitation.
The April, May, and June outlook is critical, because this is the period that we receive most of our precipitation in the Northern Great Plains (abbreviated as NGP), which influences plant growth. Most of the forage production in the NGP occurs by July 1, as our region is cool-season dominated. The seasonal forecast prediction is updated on the third Thursday of each month, so continue assessing this 3-month forecast as the April-June period progresses.
In Summary
It is not a matter of if a drought occurs, but when it occurs. It doesn’t always rain, and things don’t always go well. Be proactive with monitoring and planning for success. Explore the Rangeland Analysis Platform, and regularly assess the SD Mesonet, and the NOAA Climate Prediction Center. Based on information gathered from these free, online tools, producers should investigate drought mitigation strategies with forage planning and herd management decisions to manage their herd effectively. Reach out to your local Extension or NRCS office for help with developing trigger dates for your operation.
