Effect of Soil Texture on Water Retention

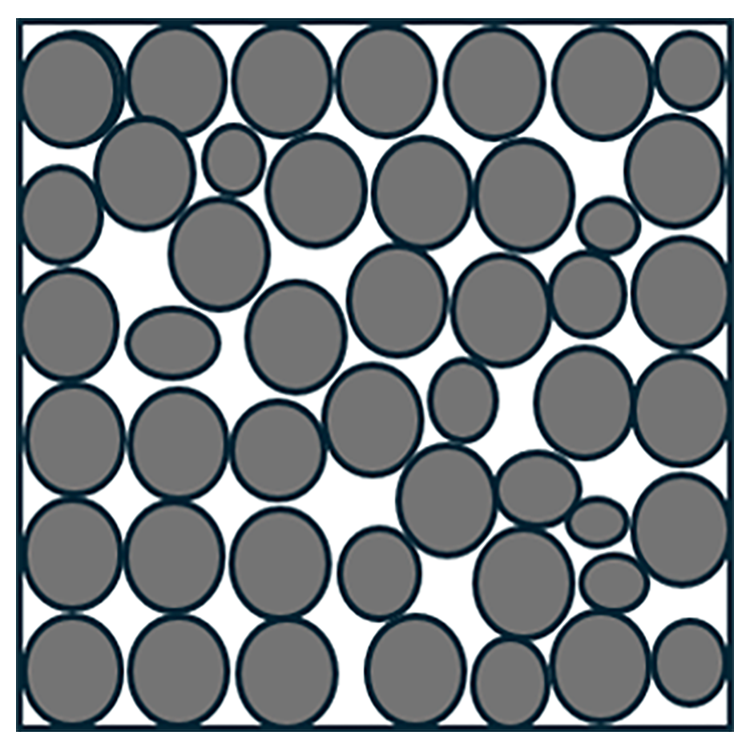
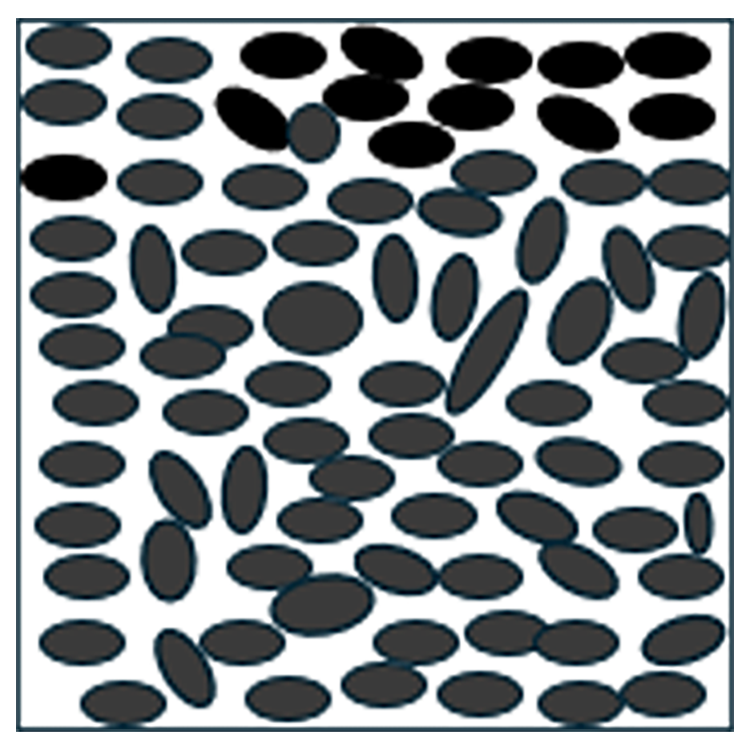
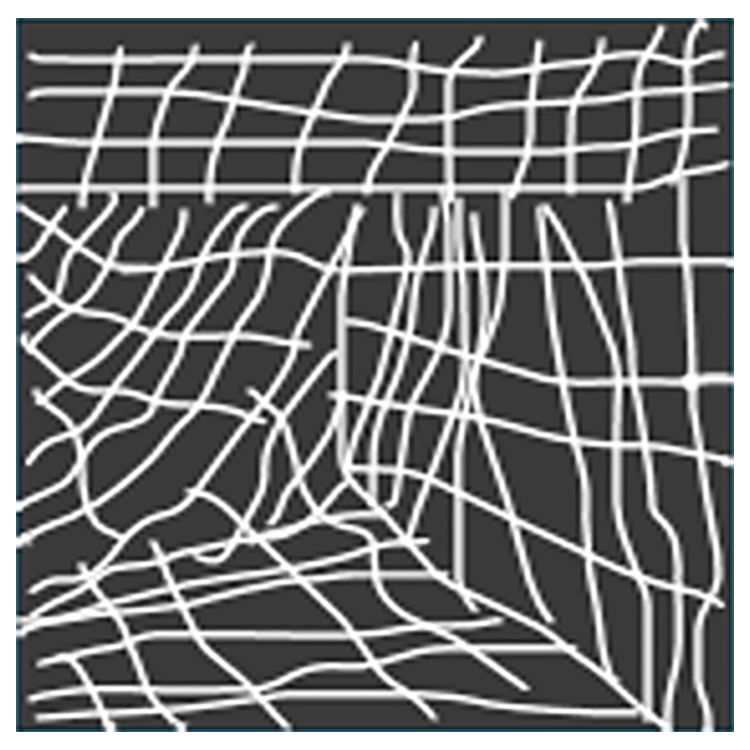
Water is essential for plant growth and comes to plants from the soil. Water infiltrates into soil through pores, which are voids between individual soil particles and clumps of particles known as soil structure. The solid portion of the soil is made up of sand (0.0021 to 0.078 inches), silt (0.000078 to 0.0021 inches) and clay (<0.000078 inches) sized particles and organic matter. Sand particles are spherically shaped and usually have large voids between individual particles. An example of the organization of sand-sized particles is shown in Figure 1. Silt-sized particles are smaller than sand-sized particles. These particles have smaller pore spaces between particles and a more-irregular arrangement of pores. Silt particles are usually oval or irregularly shaped. An example of the organization of silt particles in a soil is in Figure 2. Clay particles are the smallest of the three different soil particle sizes. Clay particles are usually flat-shaped, like a playing card, but much smaller. Clay particles have a very high surface area/volume ratio compared to sand and silt particles. An example of the organization of clay particles is in Figure 3. In clayey soils there are many small pores and there is a disorderly organization of pores. Water flows quickly through sand-sized particles due to large and well-connected pores. In clayey soils, the pores are irregularly shaped and many of them are small, which leads to water flowing through the soil at a much slower rate. However, little water is retained in sandy soils due to well-connected large pores. In clayey soils there are many small irregular pores, which leads to greater water retention. Water retention of the soil is affected by both soil structure and texture. Organic matter content of the soil also affects how much water is retained by the soil. Organic matter is important in the formation of structure and has high surface area, which can absorb water. Soils with high organic matter content generally have higher water retention. Water is retained in soil pores and can be stored in the interlayers of certain clay minerals.
Sand
Silt
Clay
Porosity and Saturated Water Content
Porosity is a measure of the total pore space contained in a soil. The saturated water content is usually about equal to soil porosity. Saturated water content can be measured by soaking a soil core in water until it will no longer absorb water, then weighing the sample. Then the sample is oven dried to determine dry mass of soil inside the ring. Porosity is frequently determined by the relationship between the weight of dry soil in a volume of soil and the density of soil particles. Because of this relationship, as bulk density increases the porosity decreases. Sandy soils and subsurface soils usually have a lower porosity and saturated-water content than surface, clayey, or high-organic-matter soils.
Soil Water Retention Curve
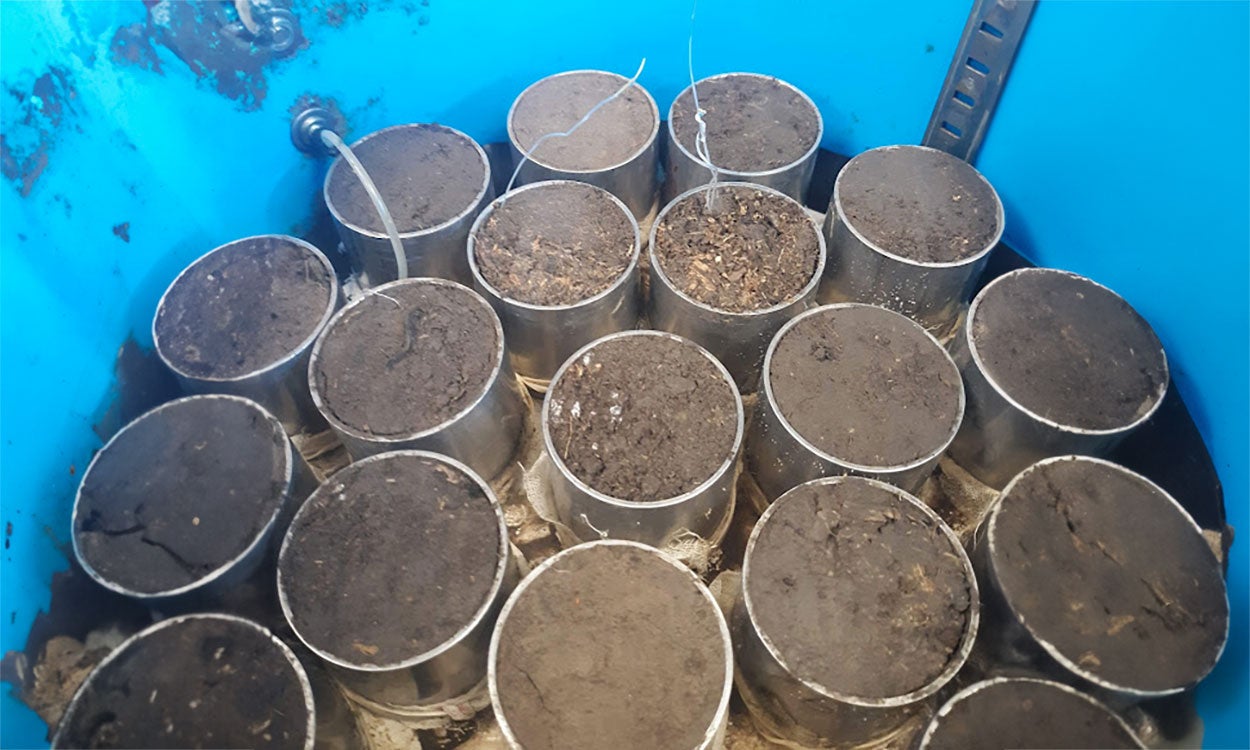
Soil water retention measurements, scientifically referred to as a curve, are a commonly measured soil physical property. Water content is measured when different pressures are applied to the soil. Also, how strong water is held by the soil particles can be measured by different laboratory instruments. The data from measuring the soil water content at different pressures (water potentials) is made into the soil water retention curve. The soil water retention curve is important for hydrology and soil science. An example of a soil water retention curve for a sand, silt loam, and clay textured soil is shown in Figure 4. A strong negative force is required for water to be released from a clay soil texture; however, water is easily released from sandy soils. This is why the clay textured soils retain more water, whereas the sandy soils retain much less water. When soil is compacted (higher bulk density, but lower porosity) the soil will retain less water at water pressures (potentials) closer to 0, but it will retain more water when the potential becomes more negative. The many fine pores in clay textured soils require a very negative pressure (potential) for water to be extracted from them. An example of trimmed cores used to measure a soil water retention curve is pictured in Figure 5.

Field Capacity, Wilting Point, Plant Available Water and Water Holding Capacity
There are different points on the soil water retention curve that are commonly used to indicate how much water the soil can store for plants. Field capacity is the amount of water that the soil retains when water is no longer drained from the soil by gravity. This is commonly assumed to be water content at -10kPa (1.45 PSI) in sandy soils and -33 kPa (4.79 PSI) in loamy and clay textured soils. A visual estimation of field capacity is a sponge that was saturated and then has been allowed to drain by gravity. Field capacity generally increases as soil organic matter and clay content increases. When water content of the soil is above field capacity, water will freely flow downward in the soil profile.
The permanent wilting point is the soil water content where plants can no longer extract water from the soil. Plants theoretically will die if the soil remains at this water content or below for an extended period of time. Permanent wilting point is measured by determining the soil water content at -1500 kPa (217.5 PSI). Water is very strongly held between interaggregate pores and absorbed to clays when the soil is at wilting point. Soils with higher clay and organic matter content generally have a higher permanent wilting point. Clay content increases wilting point more than organic matter content.
Plant available water is the amount of soil water that is available to plants. Plant available water is determined by subtracting wilting point from field capacity. Water retained by the soil between field capacity and saturation and less than wilting point is not considered to be plant available. An example of field capacity and wilting point for different soil textures is shown in Figure 6.

Plant available water is indicated by the arrow and is the difference between field capacity and wilting point. Intermediate soil textures, like a silt loam, generally have the highest plant available water. This is due to this soil texture containing a variety of soil pore sizes. Usually, an increase in soil organic matter content increases plant available water in the soil.
Water holding capacity is another soil property that can be measured. This is measured by saturating a soil with water then allowing it to freely drain until water stops dripping. This value is similar to what field capacity is. However, the water potential that this occurs at may vary depending on soil texture. The water potential would be closer to 0 in sandy soils and water potential is more negative in finer textured soils.
Converting Volumetric Water Content to Inches of Water in Soil
In the laboratory or on disturbed soil samples, water content is usually measured gravimetrically. Gravimetric water content is the mass of water per mass of oven-dry soil. This is usually converted to volumetric water content by multiplying by the measured or estimated bulk density. Volumetric water content is the volume of water contained in a volume of soil. Sensors that measure soil water content usually measure volumetric water content or soil water tension. The soil water tension can be converted to volumetric water content based on a soil water retention curve. A future SDSU Extension article will be written on soil sensors that can measure soil water content. Producers that use irrigation are interested in how many inches of water is available in the soil profile. This is also important to know how much water will be stored from precipitation events, how much is used by growing plants, or how much needs to be added through irrigation.
An example of how to calculate inches of water in a soil profile is the following. If the soil is 20% volumetric water content, field capacity is 30%, and the wilting point is 15% in the top foot of soil. Multiplying the % volumetric water × soil depth will give you how many inches of water is in the soil depth. In the top foot of this soil, there is 1.8 inches of stored water at wilting point, 3.6 inches of water at field capacity, and 2.4 inches of water when soil is 20% water content. Inches of available water can be determined by subtracting inches of water at wilting point from the current inches of water stored in the soil depth range. This means when soil is 20% water content, 0.6 inches of water would be available (2.4 inches at 20% water content and 1.8 inches at wilting point). If you would receive an inch of rainfall, it would increase the inches of soil water to 3.4 inches, or 28.3% water content in the 0 to 12 inch depth.
Mesonet at SDState weather stations have soil water sensors installed at different locations and depths. The sensors give volumetric water content. If you look up the soil texture, you can estimate if water content is above wilting point and how much water may be available. If water content is greater than field capacity, the water may move downward from gravity and not be stored to be available to plants. An estimation of field capacity, wilting point, plant available water, and inches of water available for different soil textural classes is in Table 1. These values were determined based on an average value from many soil samples collected across the United States. However, these values may vary at different sites due to different bulk density values, clay content or type, and organic matter content.
| Soil Texture | Saturated Water Content (%) | Field Capacity (-33 kPa) (%) | Wilting Point (-1500 kPa) (%) | Plant Available Water (%) | Inches of Water Available in top foot |
|---|---|---|---|---|---|
| Sandy | 46 | 10 | 5 | 5 | 0.60 |
| Loamy Sand | 46 | 12 | 5 | 7 | 0.84 |
| Sandy Loam | 45 | 18 | 8 | 10 | 1.20 |
| Loam | 46 | 28 | 14 | 14 | 1.68 |
| Silt Loam | 48 | 31 | 11 | 20 | 2.40 |
| Silt | 48 | 30 | 6 | 25 | 3.00 |
| Sandy Clay Loam | 43 | 27 | 17 | 10 | 1.20 |
| Clay Loam | 48 | 36 | 22 | 14 | 1.68 |
| Silty Clay Loam | 51 | 38 | 22 | 17 | 2.04 |
| Silty Clay | 52 | 41 | 27 | 14 | 1.68 |
| Sandy Clay | 44 | 36 | 25 | 11 | 1.32 |
| Clay | 50 | 42 | 30 | 12 | 1.44 |
*Approximate soil water content at field capacity and wilting point, plant available water, and inches of water in the top foot for different soil textures with 2.5% organic matter. Adapted from Saxton and Rauls 2006.
Summary
Water retention is an important soil property and is related to soil texture, organic matter content, and density. Sandy soils have low water retention, whereas clayey and high-organic-matter-content soils have higher water retention. Porosity/saturated water content, field capacity, wilting point, and plant available water are commonly used measurements related to soil water retention. Water content at field capacity, wilting point, and other water contents can be converted to inches of water by multiplying × soil depth.
Reference
Saxton, K.E. and Rauls W.J. 2006. Soil water characteristics estimates by textures and organic matter for hydrologic solutions. Soil Science Society of America Journal. 70, 1569-1578
