Farm decisions are often undertaken with a very long outlook. The purchase of land or a change in a cropping system are not choices done with short-run gains in mind. As a result, structural changes in agriculture are often slow to occur and to observe. In a recent report, Brown et al. (2015) covers several aspects of structural change in South Dakota gleaned from recent Census of Agriculture volumes. Aspects related to farm size, revenue and expenses, and the changing enterprise mix of South Dakota farms from that report are highlighted here.
Size & Quantity
A common highlight of the Census of Agriculture are changes in the number and size of farms. In South Dakota, the number of farms had been falling for decades while the average farm size had slowly grown. With a fixed area of farmland, those two aspects would generally move in opposite directions. In 2012, that trend stopped in South Dakota. This was due, in part, to a slight change in the definition of a farm. Thus, some small farming operations were added to the statewide count. In 2012, there were 31,989 farms in South Dakota with an average farm size of 1,352 acres. The aggregate statistics mask underlying spatial features. For example, the average farm size ranges from 353 acres in Minnehaha County to 5,869 acres in Harding County.
Before considering any sales or cost figures, it should be noted that there were drought conditions across much of South Dakota in 2012. Thus, especially at the county level, the production levels and costs would not necessarily reflect the long-run situation. See Decision Innovation Solutions (2014) for how drought effects were accounted for in other analysis of 2012.
Farm Types
Of all South Dakota farms, 14.5% were classified as retirement farms, where the farm operator self-declared as retired. In addition, 31.0% of farms had the operator with a primary off-farm occupation. Both of those types of farms were relatively small in terms of average size and of average sales. The mid-size family farm type, which covered 15.5% of farms, averaged 2,597 acres with average farm sales of $550,185. Another 3.4% of farms were non-family (often corporate) farms. The composition of farm operations is key to understanding future changes in farm numbers.
Household Farm-Related Income

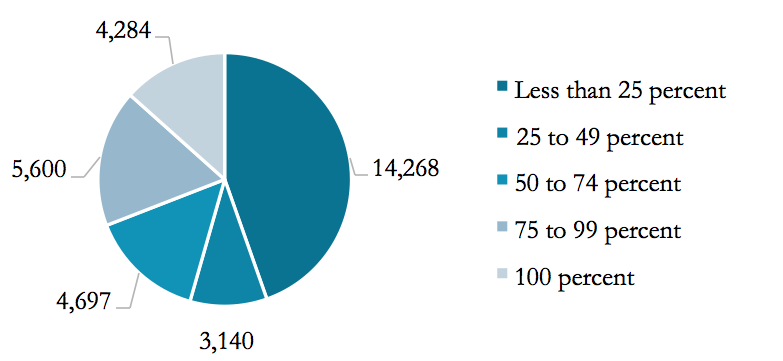
The absolute size of a farm in terms of acres or sales does not reflect the underlying profit structure or the dependency on farm-related income. Of all farm operators 14,268 or 44.6% of the total, reported in 2012 that farming contributed less than 25 percent of the total household income (Figure 1). At the same time, 14,581 operators or 45.6% of the total, received 50 percent or more of their household income from farming. The latter farm households would be more vulnerable to farm income fluctuations.
Sales Volume & Production Expenses
There is a positive correlation between sales volume and the operator’s share of income from farming. For 81.0% of farms with less than $10,000 in sales, farming contributes less than 25 percent of income. On 21.2% of farms with $100,000 to $249,000 in sales, farming contributes 50 to 74 percent of income. On 37.8% of farms with $1,000,000 or more in sale, farming contributes 100 percent of income. Across all farms, production expenses averaged $253,353 in 2012. Not surprisingly, production expenses are also positively correlated with sales class levels. On farms with less than $10,000 in sales, average production expenses were $13,227 in 2012. For farms in the $250,000 to $499,000 sales class, average production expenses were $292,287. Farms in that class still need to compensate the farm operator that may not be drawing a salary from the operation. Capital purchases, such as land principal payments, would not be production expenses, but would likely be funded with retained earnings.
Compared to earlier Census years, the situation in 2012 was one of more acres of cropland harvested, fewer acres of summer fallow, and fewer acres of cropland for grazing compared to the past 30 years. No-till production practices and the relative profitability of crops versus cattle would combine to explain the shift. More intensive cropping results in more aftermath grazing, feedstuffs production and use of co-products from processing, such as distillers’ grains. Major cash expense categories also reflect long-run shifts. Total production expenses across all farms were $8.1 billion in 2012. The largest single expense category was feed purchased, which was influenced by drought-induced demand and high feed prices. Other major categories were fertilizer, seed, rent, and purchased livestock. Not included in the cash expense was depreciation, claimed by 20,210 farms and totaling $875 million.
Enterprise Make-Up
Enterprise mix also needs a longer-run context to sort out major shifts. Looking at farms with different enterprises shows that fewer farm operations in South Dakota had wheat, dairy products and hogs compared to earlier Census periods. A notable enterprise that has increased in numbers and sales volume is poultry. A breakdown by the North American Industry Classification System (NAICS) shows a greater concentration of enterprise-specific sales by farms specializing in specific industries. For example, 88.2% of grain sales were generated by farms classified as “Oilseed and grain farming”. That proportion has climbed to match the shares of hogs and pigs generated by “Hog and pig farming” and milk from cows generated by “Dairy cattle and milk production”. An exception would be the 49.2% of cattle and calves sales by “Beef cattle ranching and farming”.
In Summary
Farm size varies across South Dakota reflecting the productivity and enterprise make-up. There is much disparity across farms in terms of dependence on farm income. Production expenses follow shifts in land use and enterprises. Finally, there is less variation of enterprises on farms than in past Census years.
References:
- Brown, H., L. Janssen, M.A. Diersen and E. Van der Sluis. The Structure of South Dakota Agriculture: 1935-2012. Research Paper 2015-1, Department of Economics, South Dakota State University, September 2015.
- Census of Agriculture
- Decision Innovation Solutions. 2014 South Dakota Ag Economic Contribution Study. September 2014.


