One way to seed cover crops is to plant them into standing crops at various growth stages. One common way that cover crops are planted into standing crops is to broadcast them aerially from equipment such as a high clearance sprayer, drone, airplane or helicopter. This is commonly done when crops are in the reproductive growth stage. This is a good time to plant the cover crop due to the crop canopy beginning to open once the crop is mature and it begins to die. This will allow sunlight to get through the crop canopy for the cover crop to use. When cover crops are broadcast they are on the soil surface and not incorporated into the soil. This makes them easier for wildlife to eat and there can be poor seed to soil contact. Due to lower potential germination the recommended seeding rate when broadcasting the cover crop is generally a higher rate versus when drill seeding. NRCS recommends seeding cereal rye at 40 lbs/ acre and camelina at 3lbs/ acre (South Dakota NRCS). When broadcasting seeding NRCS recommends seeding camelina at 4.5 lbs/ acre. NRCS generally recommends seeding cover crop at a 15% higher rate when broadcasting the seed compared to when drill seeding. However, seeding rates for certain cover crops vary widely depending upon recommendations from agronomists and seed dealers. Little is known what the right seeding rate is to optimize biomass production when rye and camelina cover crops are broadcast seeded.
Methods
Benefits to soil health generally increase as cover crop biomass production increases. This study sought to determine how seeding rate of two cover crop species and mixtures affected biomass production and some soil health indicators. The objective was to see how much biomass was produced when two cover crops species and mixtures were seeded at different rates and see how the different seeding rates and mixtures affected soil health indicators. This study was conducted at 3 locations. One location was by Spring Green, Wisconsin, another by Clear Lake, South Dakota and the last by Beresford, South Dakota. The soil texture at the Spring Green site was sand, Clear Lake was clay loam and Beresford was silty clay loam. At the Spring Green site the cover crop was broadcast onto fallow land that was disked prior to when the cover crop was broadcast. At the Beresford and Clear Lake site the cover crop was broadcast into standing corn at R4-R6 stage. At the Spring Green site camelina was not planted and biomass was not clipped from the rye + red clover and rye + red clover + classic trio mix plots in spring of 2025. The cover crop was planted on August 3rd 2024 at the Spring Green Site, August 30th at the Clear Lake site and September 5th at the Beresford Site. There were four replicates of each treatment planted. Rye was seeded at 25, 50, 75 and 100 lbs per acre and in a mixture with red clover (rye at 25 lbs/ acre and red clover at 4 lbs/ acre) and rye + red clover+ classic trio mixture (rye at 25 lbs/ acre, red clover at 2 lbs per acre and classic trio at 2 lbs/ acre). The classic trio mixture was 40% radish, 30% rapeseed and 30 % turnip. The rye and rye mixtures were spread using a broadcast lawn fertilizer spreader. Camelina was broadcast at 5 and 10 lbs/ acre by hand. The cover crop biomass was clipped on April 30th at the Beresford Site, May 2nd at Clear Lake site and May 25th at the Spring Green site. Soils were sampled at the same time the cover crop biomass was clipped prior to being terminated. Soil water content was determined on samples collected from the 0-6 and 6-24 in depth at the Beresford and Spring Green site and only from the 0-6 in depth at the Clear Lake site due to wet soil conditions when sampling. Also, soil samples were collected from the 0-3 in depth and organic matter, particulate organic matter, dry aggregate size distribution and percent water stable aggregates was measured on these samples. If the percent water stable soil aggregates is closer to 100 % the soil is likely to stay together when wet by rainfall or irrigation but if its closer to 0 the structure is more likely to fall apart and the soil is more susceptible to water erosion. Generally if the average diameter of dry soil aggregates is higher the soil is less likely to blow away from high winds. Soil available nitrogen will be measured at a later date. In addition, penetration resistance was measured as an indication of soil compaction for the 0-3 and 3-6 in depth. A lower penetration resistance means that the soil is not compacted and roots can easily penetrate through it. Also, time for 1 in and a 2nd inch of water to infiltrate was determined.
Results
Climate
There was a weather station at the SDSU Southeast Research Farm (Beresford). However, data for the Clear Lake site is from the SDSU Mesonet Oak Lake Research Station and data for Spring Green is from the Lone Rock Wisconsin Airport which were closest available weather stations with data posted online (National Weather Service 2025; South Dakota Mesonet 2025). Although they are not at the exact location, they give an indication of how much precipitation was received in the area. Monthly precipitation received during the time that cover crops were growing is shown in Table 1.
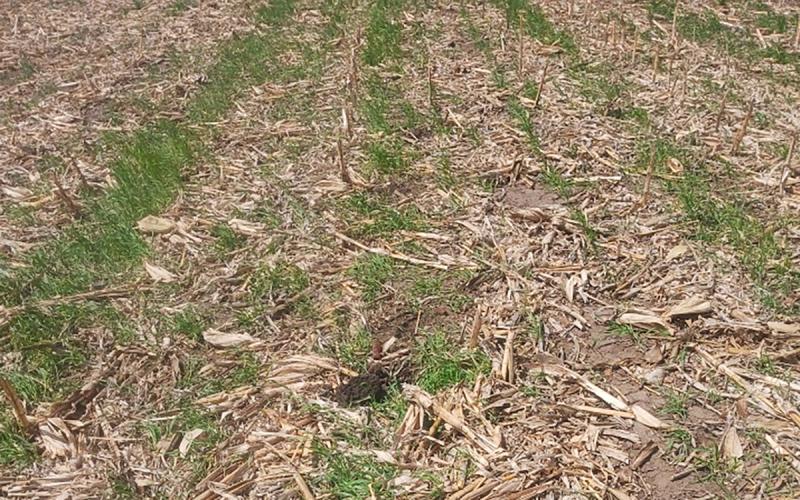
At the initiation of the study the water content was 0.05 lb/lb in the 0-6 and 6-12 in depth at the Spring Green Site, 0.26 lb/lb at the Clear Lake site in the 0-6 and 6-12 in depth and was 0.16 lb/lb in the 0-6 in and 0.19 lb/lb in the 6-12 in depth at Beresford when the cover crop was planted. Precipitation data is included in table 1 to show that in Fall 2025 little precipitation was received to establish the cover crop at two of the sites and it did not germinate until spring 2025 at the Clear Lake and Beresford sites. Photos of the cover crops are shown in Figures 3-7 in the next section of this article.
| Beresford | Clear Lake | Spring Green | |
|---|---|---|---|
| Month | Precipitation (inches) | ||
| August 24 | 1.63 | 2.32 | 2.66 |
| September 24 | 0.2 | 0.04 | 2.01 |
| October 24 | 0.43 | 0.18 | 2.11 |
| November 24 | 1.65 | 1.93 | 4.14 |
| December 24 | 0.47 | 0.06 | 0.96 |
| January 25 | 0.02 | 0 | NA |
| February 25 | 0.13 | 0.01 | 0.29 |
| March 25 | 1.41 | 1.01 | 3.07 |
| April 25 | 1.5 | 2.12 | 3.13 |
| May 25 | 1.66 | 2.71 | 2.36 |
Biomass Production
The cover crop did not germinate in Fall 2024 at the Beresford and Clear Lake sites featured in this study, so the fall biomass was not clipped. At the Spring Green site in this study, which received more precipitation, the cover crop did germinate and biomass was clipped on November 25, 2024.
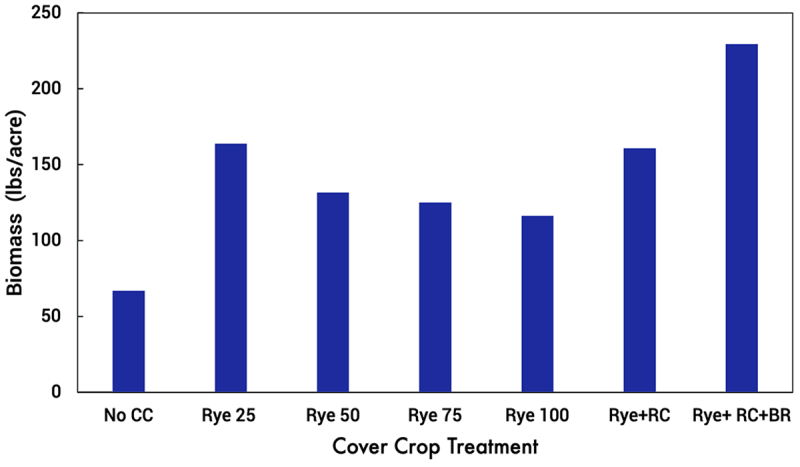
This study found that adding the classic trio and red clover with the rye increased the cover crop biomass production by 80 to 100 pounds per acre compared to just planting the rye cover crop at any seeding rate (Figure 1).
In spring of 2025 there appeared to be little clover growing in the rye and red clover plots at the Spring Green Site. Biomass clipped in the no cover crop plot at Spring Green was mostly weeds. Rye seeding rate did not affect spring biomass production at the Spring Green site. (Figure 2).
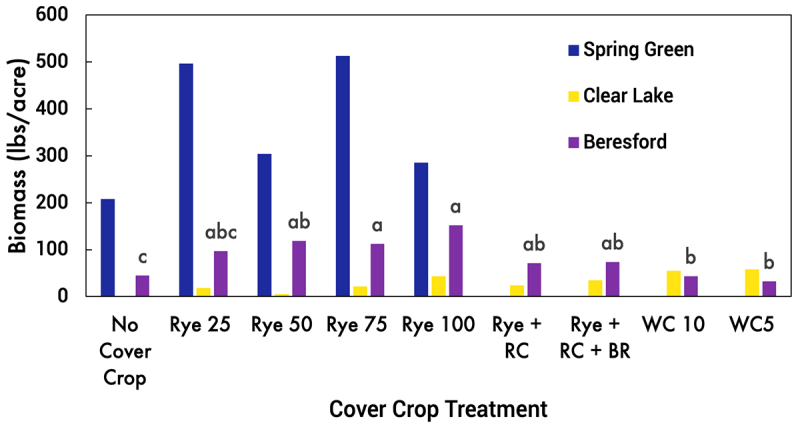
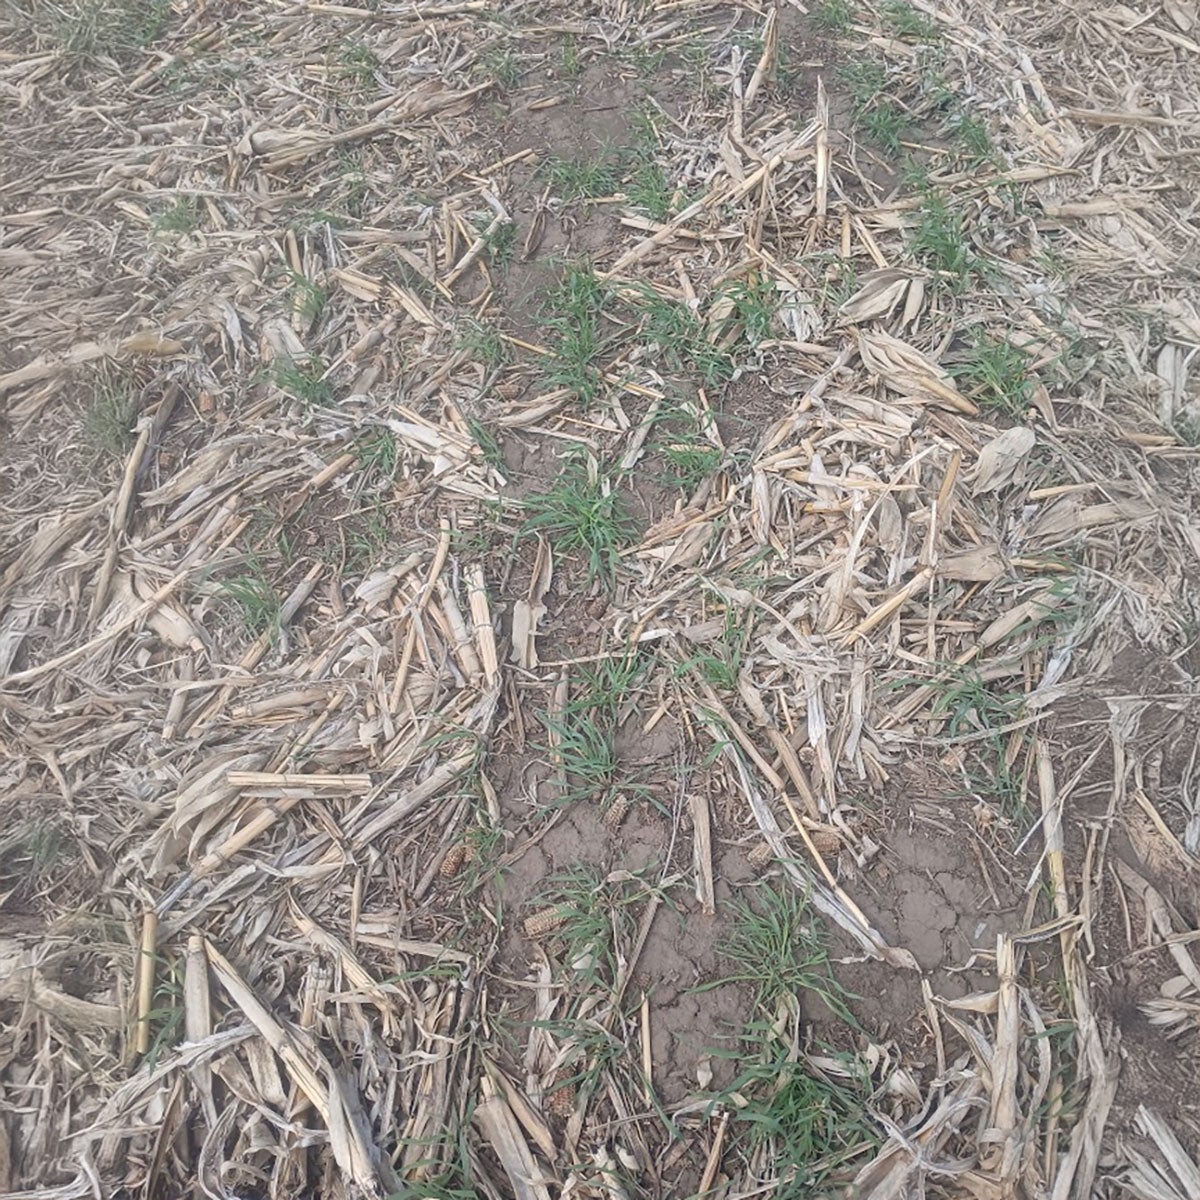
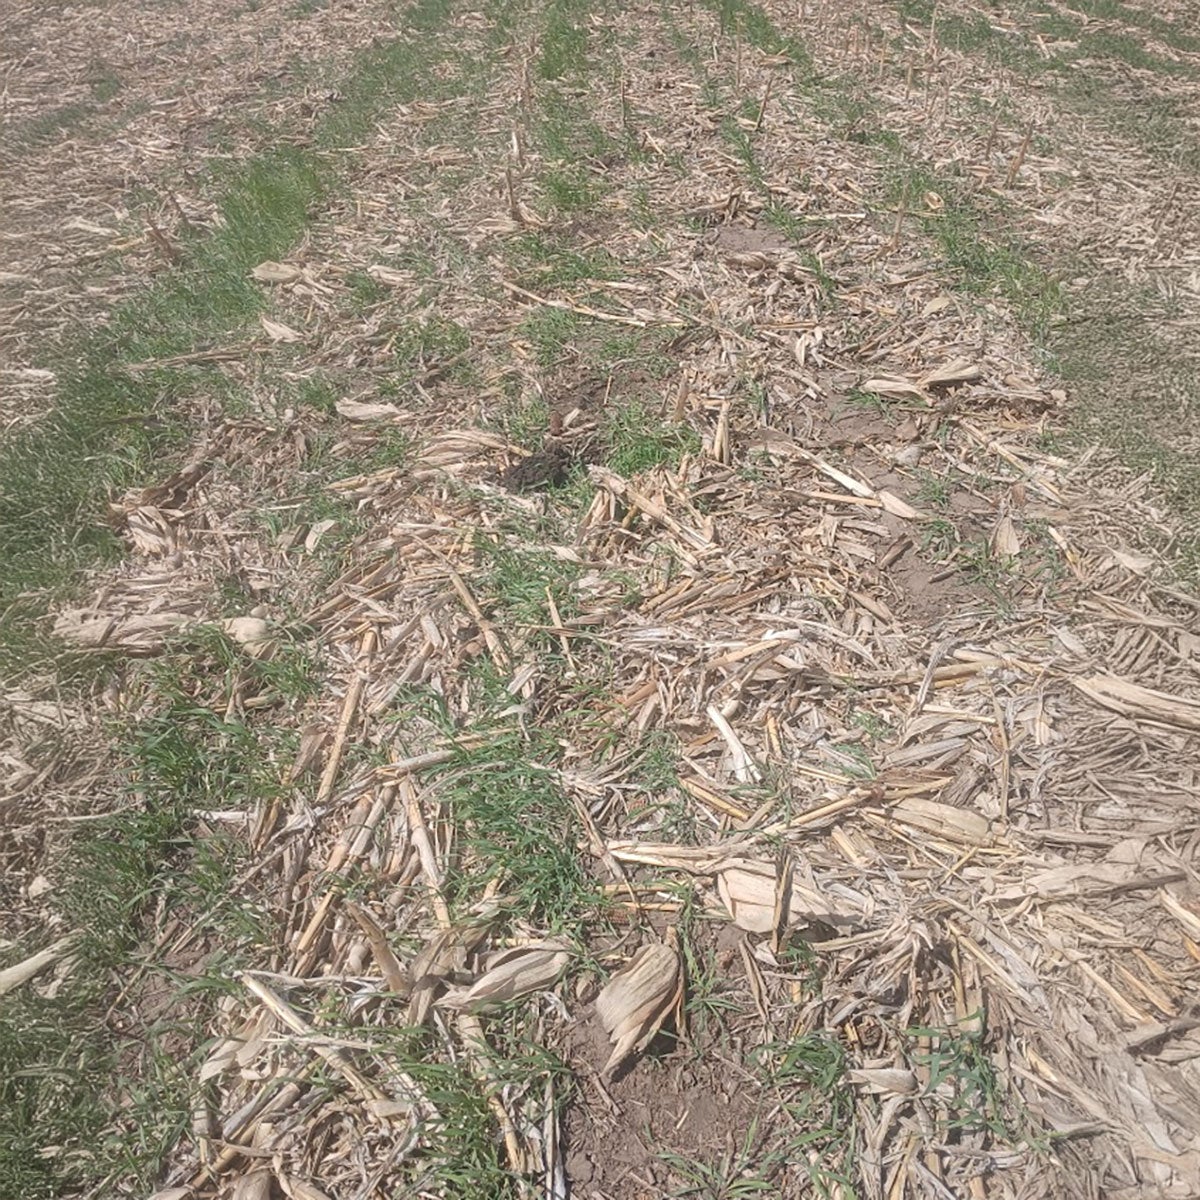
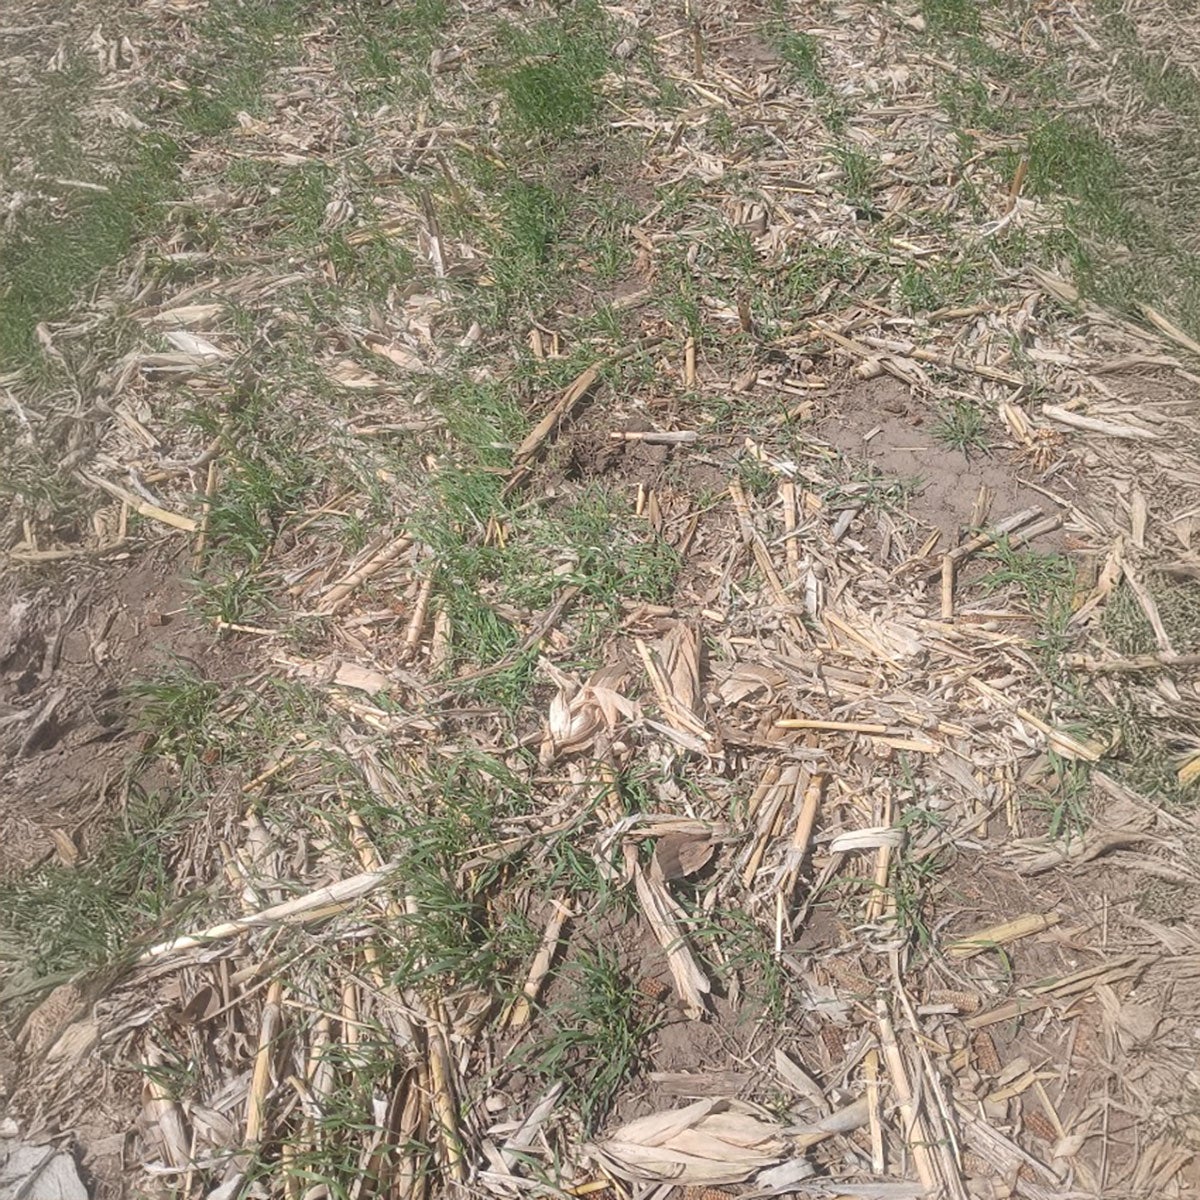
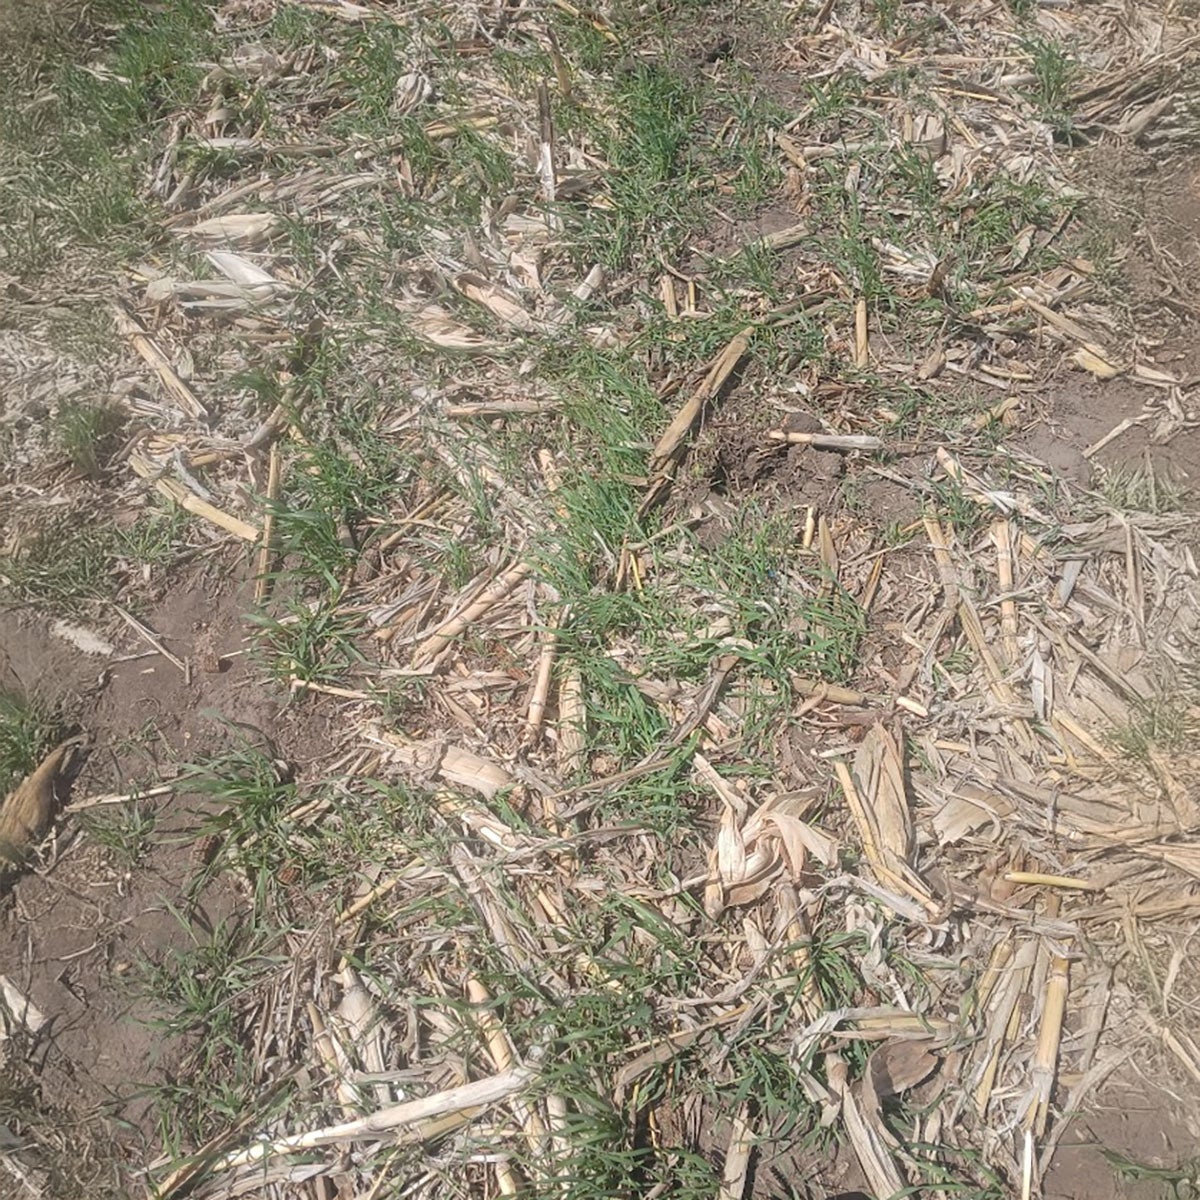
At the Beresford site rye was accidentally drill-seeded where the cover crop was planted. The no-cover crop plot biomass indicates how much biomass was produced from the drilled cover crop. The winter camelina, classic trio and red clover cover crops germinated poorly at Beresford with only an occasional small plant visible when walking through the plots. Among rye seeding rates there was no statistical difference in biomass production although the higher seeding rate did have a little higher biomass production (Figure 2). However, the winter camelina and no cover crop treatment did have lower biomass production compared to where rye was broadcast (Figure 2). Biomass production from the different cover crop mixtures ranged from 33 to 152 lbs/acre (Figure 2). The rye treatments at this site include the drilled rye plus the rye that was broadcast prior to harvest of the corn. Photos of rye planted at the different seeding rates at this site are in Figures 3-7.
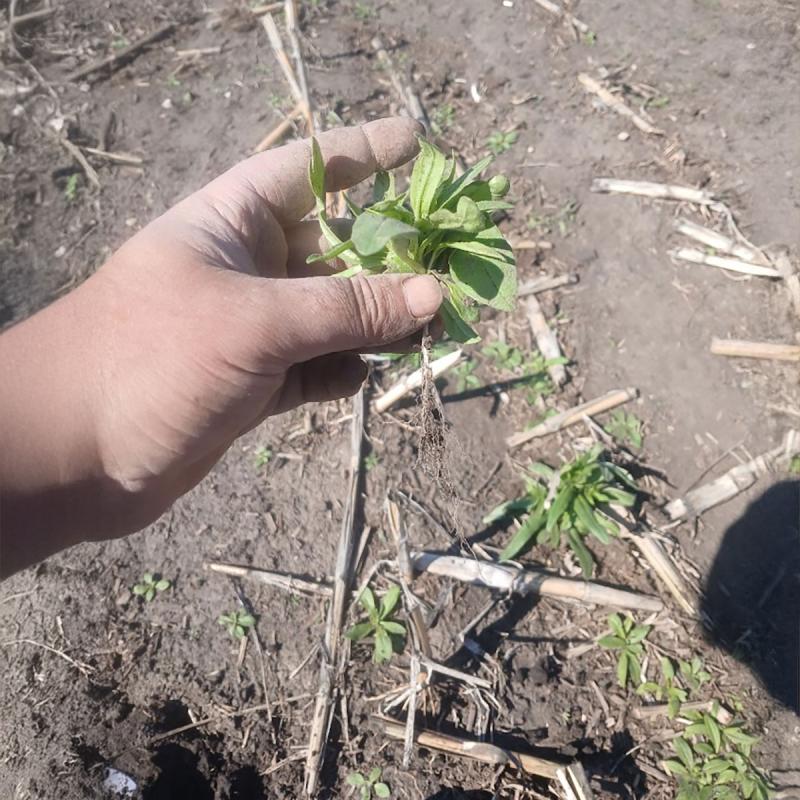
At the Clear Lake site there was the lowest biomass production. The camelina germinated better than the rye cover crop in spring of 2025. Although there was no statistical differences the camelina plots produced a little more biomass compared to the rye cover crop or rye mixtures. However, average biomass production at this site was low (<60 lbs/ acre). It is worth noting that drilled rye cover crop only produced (92 lbs/acre) of biomass in the same field. A photo of the camelina planted at this site is shown in Figure 7.
25 Pounds Per Acre
50 Pounds Per Acre
75 Pounds Per Acre
100 Pounds Per Acre
Soil Properties
Some soil properties were measured as indicators of soil health. Total organic matter was measured as an indication of soil health and is commonly measured in routine soil analysis. Generally, soils that have higher organic concentration have better soil health. Particulate organic matter is mostly organic matter added from plant roots and residues and should change more rapidly by management than total soil organic matter. At the initiation of the study the soil organic matter level was 5.8 % at the Beresford site, 7.1 % at the Clear Lake site and 1.4 % at the Spring Green site in the 0-6 in depth. Particulate organic matter was 0.68 % at the Beresford site, 0.98 % at the Clear Lake site and 0.81 % at the Beresford Site in the 0-6 in depth. Soil properties generally were not affected by the cover crop seeding rates or species (Tables 2-4). The only soil property that was affected by cover crops treatments was penetration resistance at the Beresford site (Table 2). Rye seeded at 50lbs or higher per acre had higher penetration resistance than no cover crop, rye in mixtures and camelina. However, the penetration resistance was much less than the 2 MPa (290 PSI) that can restrict root growth (Sinnett et al., 2008). Other soil properties were not affected by cover crop seeding rate or mixtures at the Beresford site (Table 2). At the Clear Lake and Spring Green site none of the soil properties were affected by cover cropping (Tables 3 and 4). Although there may appear to be differences in soil properties between treatments there was a lot of variability in the soil properties at the sites. It is worth noting that soil water content was not affected by cover cropping. Many producers are concerned about cover crops taking up water that could be available to the crop planted following the termination of the cover crop. Lack of change in soil properties is likely due to cover crops being planted for only one year and very low biomass production from the cover crop. To improve soil health cover crops need to produce significant biomass (>1000 lbs/acre) and or be planted for a long period of time. Having the cover crop add lots of carbon to the system (organic matter) is needed to improve soil health. The results of this study should be taken with caution as cover crops were only planted for 1 year and did not perform well.
| Treat- ment | Water Content (0-6 in) (lb/lb) | Water Content (6-24 in) (lb/lb) | Organic Matter (%) | Partic- ulate Organic Matter (%) | Penet- ration Resist- ance 0-3 in (PSI) | Penet- ration Resis- tance 3-6 in (PSI) | 1st in Infilt- ration Time (min) | 2nd in Infilt- ration Time (min) | Percent Water Stable Aggr- egates | Avg. Dry Aggr- egate Diameter (in) |
|---|---|---|---|---|---|---|---|---|---|---|
| No Cover Crop | 0.22 | 0.25 | 5.86 | 1.08 | 42.25b | 47b | 1.37 | 18.91 | 0.82 | 0.282 |
| Rye 25 lb / acre | 0.23 | 0.25 | 5.68 | 1.28 | 42.5bc | 53.5b | 2.37 | 11.92 | 0.85 | 0.273 |
| Rye 50 lb/ acre | 0.22 | 0.25 | 5.66 | 1.18 | 53ab | 64ab | 2.38 | 12.16 | 0.91 | 0.265 |
| Rye 75 lb/ acre | 0.22 | 0.24 | 6.13 | 1.30 | 53.5ab | 70.5ab | 1.40 | 8.31 | 0.84 | 0.227 |
| Rye 100 lb/ acre | 0.22 | 0.25 | 5.45 | 1.07 | 61.5a | 79a | 5.21 | 17.10 | 0.77 | 0.235 |
| Rye + RC | 0.23 | 0.24 | 5.16 | 1.07 | 44.5c | 50.5ab | 1.95 | 11.08 | 0.75 | 0.224 |
| Rye + RC + BR | 0.23 | 0.25 | 5.76 | 1.20 | 40bc | 47.5b | 3.60 | 23.47 | 0.83 | 0.332 |
| WC 5 lb/ acre | 0.23 | 0.25 | 5.99 | 1.52 | 42bc | 44.5b | 1.97 | 11.6 | 0.87 | 0.163 |
| WC 10 lb/ acre | 0.23 | 0.26 | 5.55 | 1.10 | 37.5bc | 43.5b | 1.55 | 11.95 | 0.77 | 0.202 |
*RC is red clover, WC is winter camelina and BR is classic trio mixture consisting of radish, turnip and rapeseed. Different letters following numbers indicate statistical significance at p=0.05
| Treat- ment | Water Content (0-6 in) (lb/lb) | Organic Matter (%) | Partic- ulate Organic Matter (%) | Penet- ration Resist- ance 0-3 in (PSI) | Penet- ration Resis- tance 3-6 in (PSI) | 1st in Infilt- ration Time (min) | 2nd in Infilt- ration Time (min) | Percent Water Stable Aggr- egates | Avg. Dry Aggr- egate Size (in) |
|---|---|---|---|---|---|---|---|---|---|
| No Cover Crop | 0.27 | 6.80 | 0.66 | 176 | 178 | 1.73 | 7.26 | 0.95 | 0.172 |
| Rye 25 lb /acre | 0.27 | 7.08 | 1.49 | 199.5 | 202 | 0.95 | 4.49 | 0.95 | 0.174 |
| Rye 50 lb/ acre | 0.28 | 7.28 | 1.52 | 198 | 201.5 | 1.19 | 10.18 | 0.93 | 0.204 |
| Rye 75 lb/ acre | 0.27 | 7.37 | 1.49 | 203 | 206 | 1.05 | 4.46 | 0.95 | 0.129 |
| Rye 100 lb/ acre | 0.27 | 7.94 | 1.22 | 193 | 197 | 1.08 | 5.83 | 0.98 | 0.136 |
| Rye + RC | 0.27 | 6.84 | 1.42 | 199 | 198.5 | 1.09 | 5.42 | 0.93 | 0.189 |
| Rye + RC+ BR | 0.26 | 6.80 | 1.55 | 201.25 | 201.25 | 0.60 | 3.71 | 0.92 | 0.094 |
| WC lb/ acre | 0.26 | 7.66 | 1.69 | 211.5 | 215 | 1.44 | 5.04 | 0.93 | 0.125 |
| WC 10 lb/ acre | 0.27 | 6.74 | 1.18 | 194 | 195 | 1.01 | 4.00 | 0.96 | 0.179 |
*RC is red clover, WC is winter camelina and BR is classic trio mixture consisting of radish, turnip and rapeseed. There were no statistical differences between treatments
| Treat- ment | Water Content (0-6 in) (lb/lb) | Water Content (6-24 in) (lb/lb) | Organic Matter (%) | Partic- ulate Organic Matter (%) | Penet- ration Resist- ance 0-3 in (PSI) | Penet- ration Resis- tance 3-6 in (PSI) | 1st in Infilt- ration Time (min) | 2nd in Infilt- ration Time (min) | Percent Water Stable Aggr- egates | Avg. Dry Aggr- egate Diameter (in) |
|---|---|---|---|---|---|---|---|---|---|---|
| Rye 25 lb /acre | 0.053 | 0.061 | 1.66 | 1.19 | 159 | 280 | 1.40 | 2.75 | 0.91 | 0.091 |
| Rye 50 lb /acre | 0.049 | 0.057 | 1.72 | 1.27 | 136 | 256 | 1.38 | 2.38 | 1.00 | 0.071 |
| Rye 75 lb/ acre | 0.057 | 0.063 | 1.77 | 0.79 | 157 | 270 | 1.65 | 2.44 | 0.89 | 0.131 |
| Rye 100 lb/ acre | 0.051 | 0.055 | 1.52 | 0.82 | 134 | 277 | 0.89 | 2.50 | 0.78 | 0.125 |
*None of the data was statistically different from each other.
Summary
This research report determined the performance of cover crops seeded at different rates and mixtures at three sites. The seeding rate of rye and camelina did not affect the biomass production. At one of the sites rye cover crop produced more biomass than camelina. The conditions for growing the cover crop were less than ideal due to little precipitation received during fall of 2024 to establish the cover crop. Even cover crop that was drill seeded at the study locations did not produce a lot of biomass. There were no changes in soil properties from cover cropping which is likely due to poor performance of the cover crop. This trial will be conducted again this fall to see if the results will differ in another growing season.
References
- National Weather Service 2025. Now Data-NOAA Online Weather Data.
- Sinnett, D., Morgan, G., Williams, M., & Hutchings, T. R. (2008). Soil penetration resistance and tree root development. Soil Use and Management, 24(3), 273-280.
- South Dakota Mesonet, South Dakota State University. (2025). South Dakota Mesonet Database [database].
- South Dakota NRCS. Cover Crop Table 1. South Dakota NRCS Cover Crop Web page.