Written collaboratively by Tong Wang and Oranuch Wongpiyabovorn.
According to the recently released 2022 Census of Agriculture (USDA, 2022), crop variety has slightly increased in South Dakota (abbreviated as SD) over the past five years (2017-2022).
Overall Crop Shares
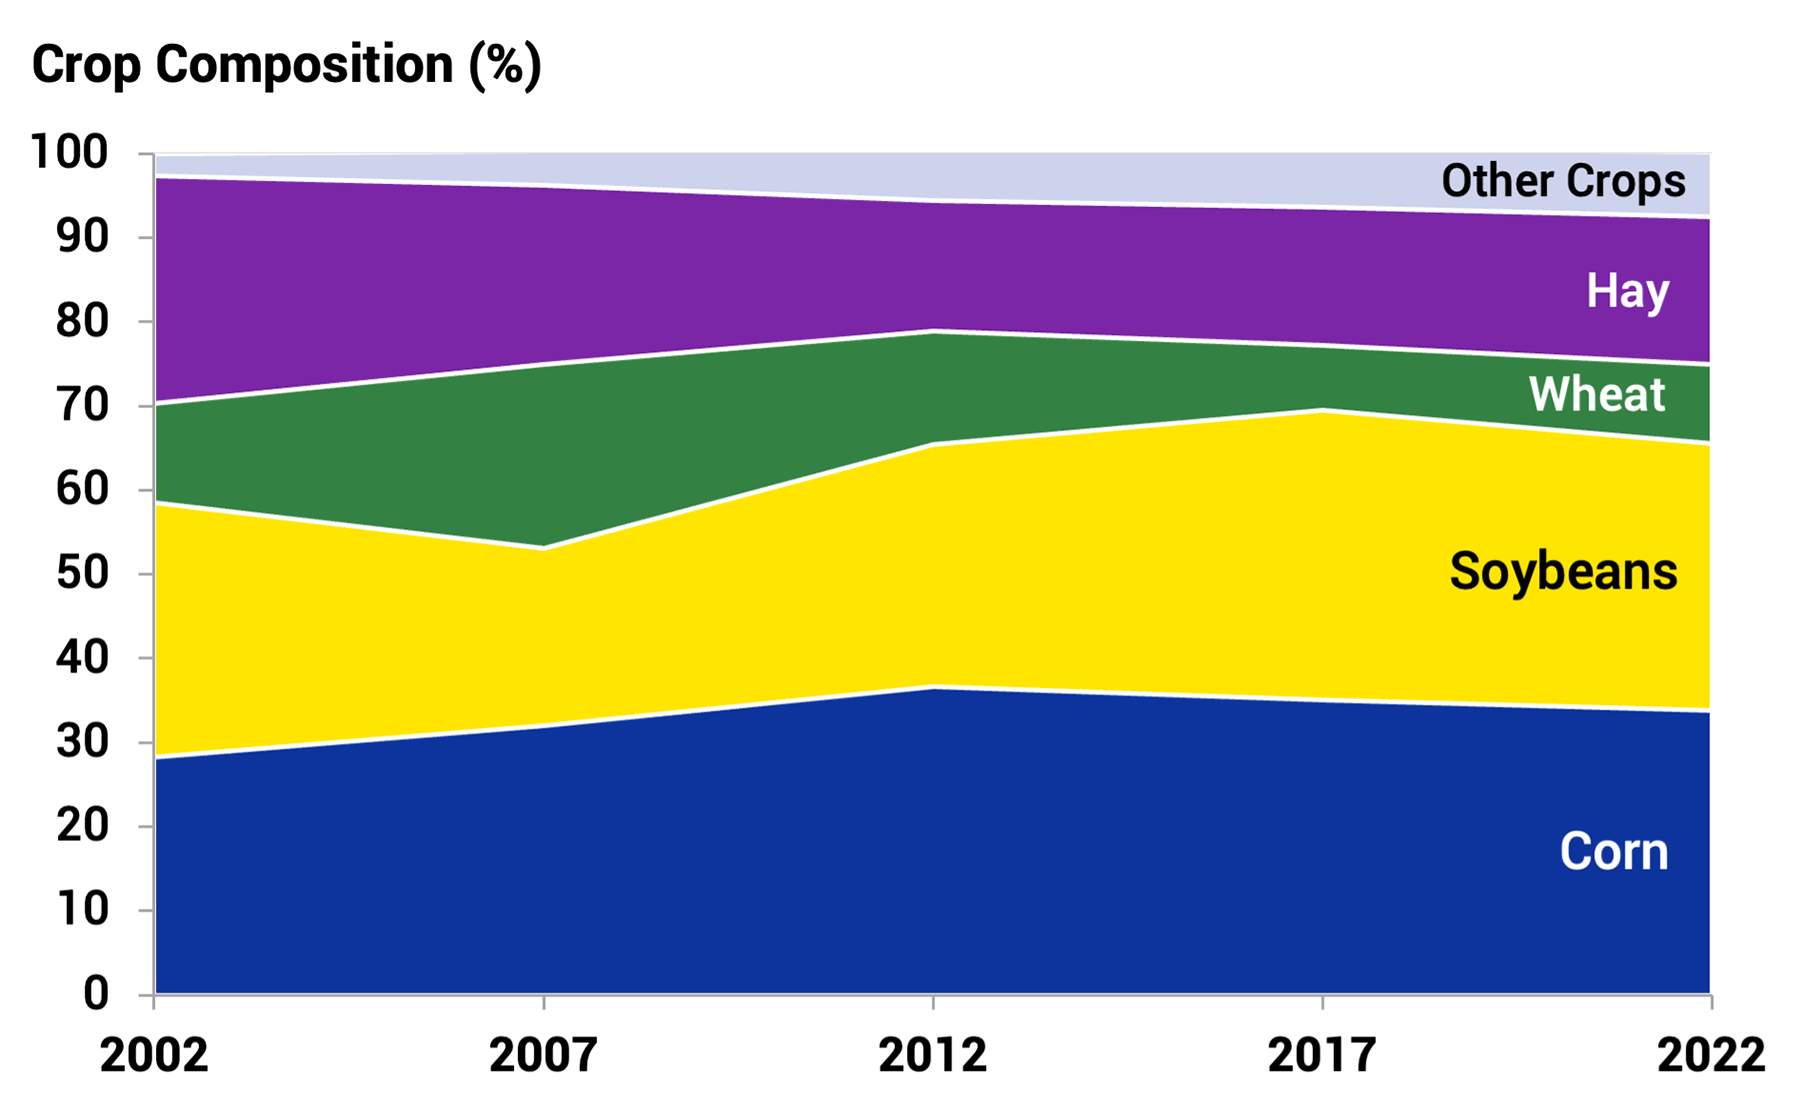
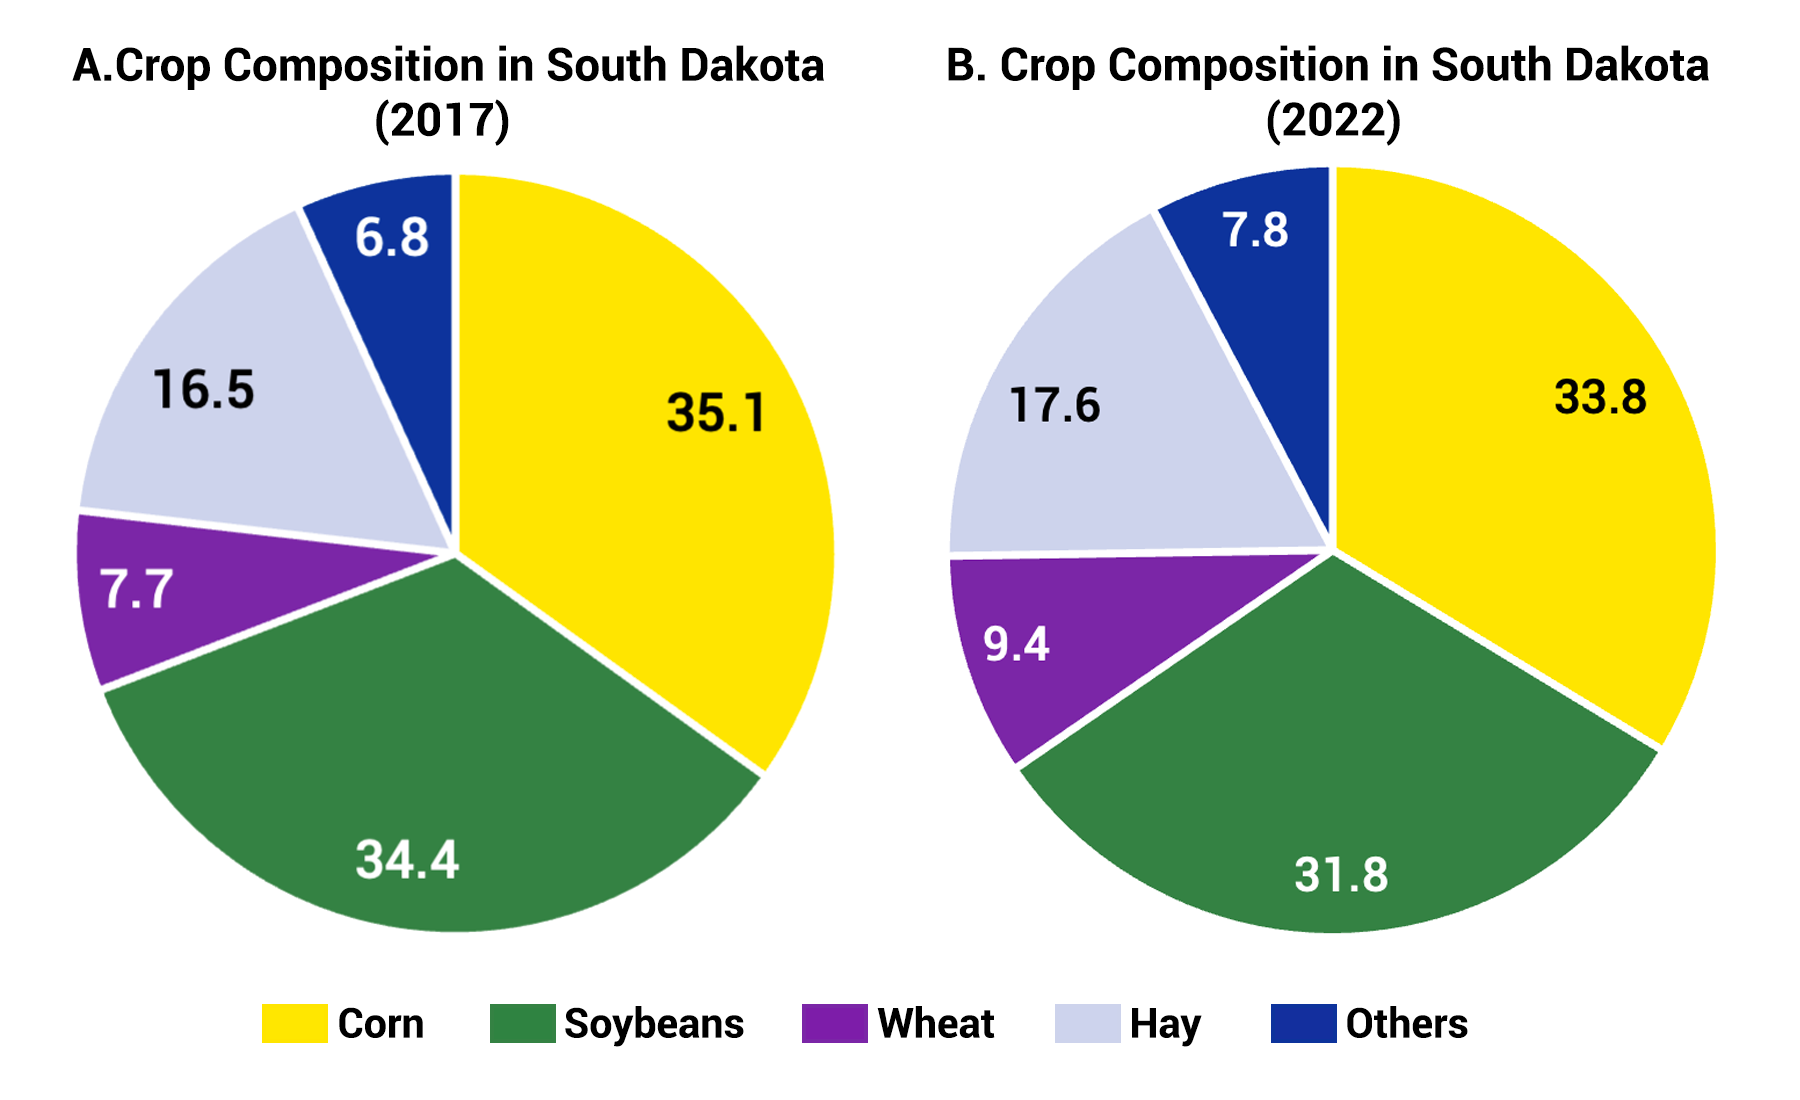
Between 2007 and 2017, the combined shares of soybean and corn acres in South Dakota have increased gradually from 53.1% to 69.6%, associated with a sharp decline in the share of wheat acres from 21.9% to 7.7% (Figure 1). During 2017-2022, the share of corn acres slightly declined from 35.1 to 33.8%, and the share of soybean acres also experienced a minor decline from 34.4 to 31.8% (Figure 2). Meanwhile, the share of wheat acres experienced an increase for the first time since 2007, albeit minor, from 7.7 to 9.4% (Figures 1 and 2). In addition, shares of hay and other crops (including sunflowers, oats, sorghum, and barley) have increased by 1% (from 6.8 to 7.8%) over the past five years (Figure 2).
County-Level Crop Shares
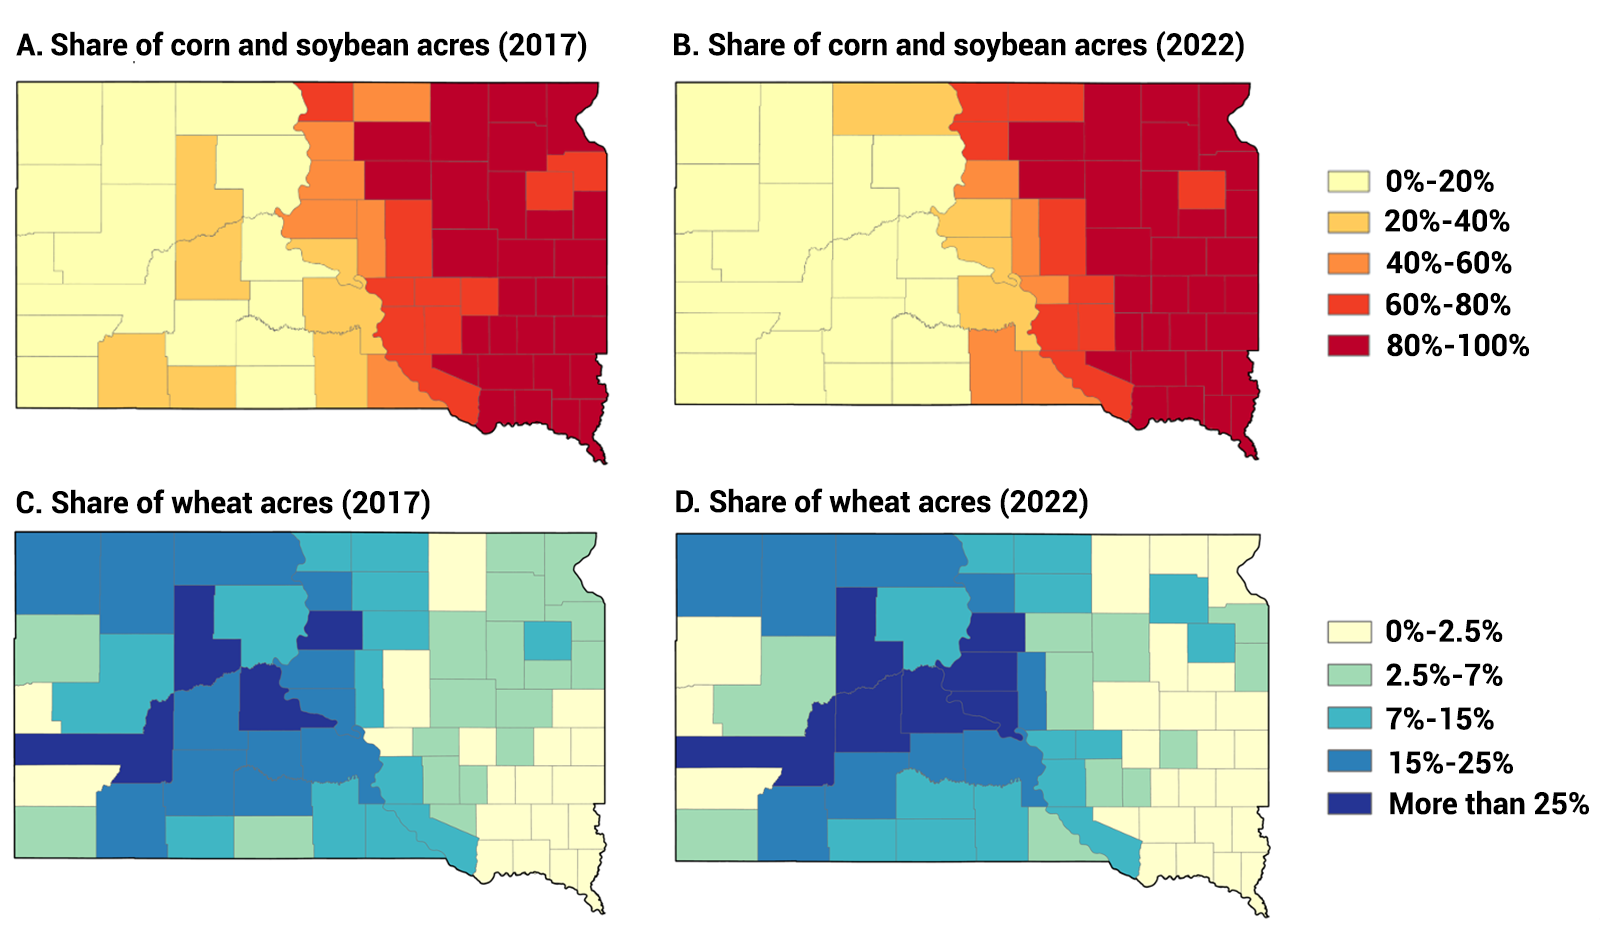
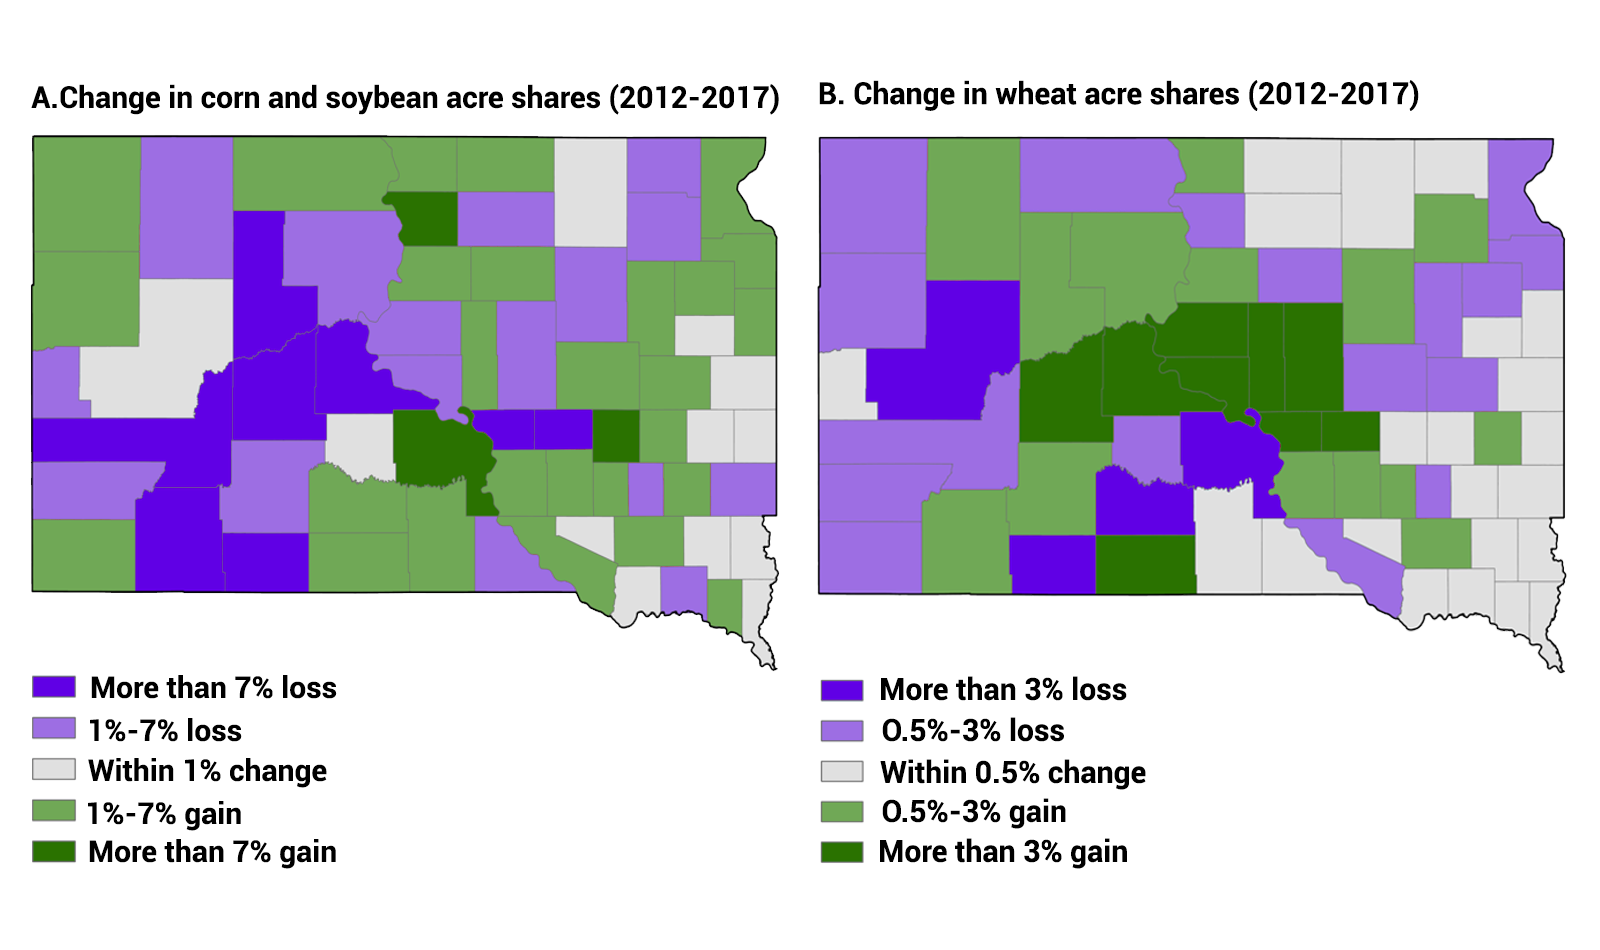
A scrutiny of crop composition at the county level further revealed that the shares of corn and soybean acres exceeded 80% in most counties in Eastern SD for the two recent census years, 2017 and 2022 (Figures 3-A and 3-B). Moving along the east-west gradient in SD, the annual precipitation declines, accompanied with a gradual decrease in the share of corn and soybean acres, from more than 80% in Eastern SD to less than 20% in Western SD. During 2007-2012, most of the Eastern SD counties experienced either no major change (within 1%) or increases in corn and soybean acres (by 1 to 7%). In contrast, there have been declines in share of corn and soybean acres in most of the Central and Western SD counties (Figure 4-A).
In contrast to corn and soybean acres, which are concentrated in Eastern SD, wheat acres are mostly located in Central and Western SD (Figure 3-C and 3-D). During 2017-2022, many Central SD counties have experienced increases in the share of wheat acres (Figure 4-B). In 2017, only four counties in Central SD had more than a quarter of harvested crop acres in wheat; namely, Pennington (26.8%), Potter (26.5%), Stanley (32.4%) and Ziebach (26.6%). As of 2022, seven counties in Central SD had wheat acre shares exceed 25%. These are Haakon (27.4%), Hughes (32.5%), Pennington (26.1%), Potter (27.3%), Stanley (50.4%), Sully (33.5%), and Ziebach (27.3%). In comparison, most Eastern SD counties either experienced no changes, or had reductions in wheat acres.
Production Insights
Overall, cropping variety in SD has slightly increased during 2017-2022, yet the variety increase has primarily occurred in Central SD. In the meantime, most counties in Eastern SD experienced further declines in crop variety. The expansion of corn-soybean acres can be attributable to multiple factors, including increasing demand for food and industrial uses, genetic improvement, and infrastructure development (Wang et al., 2021). In addition, the U.S. Farm Bill, in particular the crop insurance and subsidy programs, further incentivizes intensive production of corn and soybeans (Spangler et al., 2020).
Compared to rotations of three or more crops, simplified crop rotation systems (one or two crops) rely more heavily on pesticides and fertilizers, and they negatively impact soil health as they deplete specific micronutrients and imbalance microbial communities (Feng et al. 2021). Over time, they bring more harm to the ecosystems through soil erosion and chemical runoff into connected water bodies.
Climate conditions could affect farmers’ adoption of crop rotations. The cropping systems in SD differ greatly along the east-west gradient as precipitation decreases. While the corn-soybean rotation remains the dominant cropping system in Eastern SD, crop rotation systems became more variable in Central SD. Compared to producers in Eastern SD, those farming in Central SD regions are more likely to face soil moisture deficit. Rotations of three or more crops help increase soil organic matter and infiltration rate, which therefore, improves water availability. Planting small grains such as wheat as an alternative crop has been used by farmers as an adaptation strategy during dry years (Roesch-McNally et al., 2018). In addition, crop rotation has been used as an adaptation strategy during years of high fertilizer prices (Wang et al., 2023) due to their reduced reliance on synthetic fertilizers.
References
- Feng H., T. Wang, S. L. Osborne, and S. Kumar (2021). Yield and Economic Performance of Crop Rotation Systems in South Dakota. AgroSystems, Geosciences and Environment, 4:e20196.
- Roesch-McNally, G. E., Arbuckle, J. G., and Tyndall, J. C. (2018). Barriers to implementing climate resilient agricultural strategies: The case of crop diversification in the US Corn Belt. Global Environmental Change, 48, 206-215.
- Spangler, K., Burchfield, E. K., and Schumacher, B. (2020). Past and current dynamics of US agricultural land use and policy. Frontiers in Sustainable Food Systems 4: 98.
- U.S. Department of Agriculture, National Agricultural Statistics Service (NASS) (2022). 2022 Census of Agriculture.
- Wang T., S. Heidi, M. Elliott, and S. Cheye (2023). Impact of high fertilizer prices and farmers' adaptation strategies. Choices Magazine, 38(4), 1-10.
- Wang T., H. Jin, Y. Fan, O. Obembe, and D. Li (2021). Farmers' adoption and perceived benefits of diversified crop rotations in the margins of Corn Belt. Journal of Environmental Management, 293: 112903.


