Written collaboratively by Tong Wang and Stephen Cheye.
For the first time, the 2022 Agricultural Census provides data on the use of precision agriculture (abbreviated as PA) practices. According to USDA (2022), PA practices are defined as practices that “utilize technology to improve agricultural productivity or efficiency by connecting the practice to a digital environment for crop or livestock production.” Examples of PA practices for crop production include global positioning (abbreviated as GPS) guidance systems, GPS yield monitoring and soil mapping, drones for scouting fields, and variable-rate input applications, while PA practices for livestock production include drones for monitoring livestock, electronic tagging, precision feeding, and robotic milking (USDA, 2022).
Precision Agricultural Usage Based on 2022 Agricultural Census
Based on the 2022 Agricultural Census, 6,687 out of 28,299 farms, or 23.6% of farms in South Dakota (abbreviated as SD) used precision agriculture (PA) practices. The PA usage rate in SD doubles the average PA usage rate of 11.9% in the United States, where 226,092 out of 1,900,487 farms are PA users.
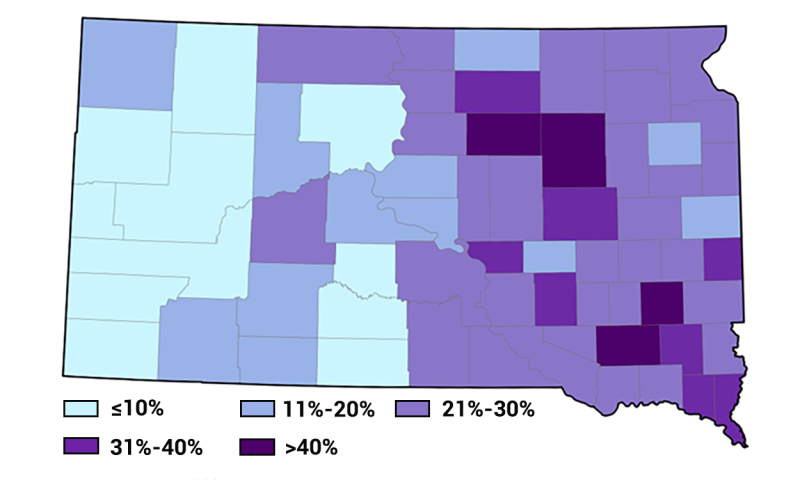
The county-level PA usage rates in SD are demonstrated in Figure 1. The PA usage rate for each county is calculated as the number of farms that use PA practices divided by the total number of farms in that county. Compared to western SD, eastern SD has a higher percentage of agricultural land under crop prodution due to factors such as more-fertile soil and higher precipitation levels. PA usage distribution patterns in Figure 1 also suggest that, compared to western SD counties, the PA usage rates are in general much higher for eastern SD counties. Therefore, we can infer that in comparison to livestock production, PA practices are more widely used for crop production.
Adoption Status of Precision Agricultural Practices by Category

PA technologies for crop production can be further divided into several categories: 1) georeferencing technologies that locate positions of interest accurately to avoid overlaps and skips; 2) diagnostic technologies that gather farm information during the growing and harvesting period, which include sensors, satellite images, unmanned aerial vehicles, and yield monitors; and 3) variable rate (abbreviated as VR) technologies that enable site-specific management responses based on information gathered from diagnostic technologies.
While 2022 agricultural census data provides the overall PA usage sectors for crop and livestock sectors, further information on PA usage rates under specific categories is not available. In this regard, our 2021 Farmer Survey on PA usage offers more insights. During July to September 2021, we conducted a Midwest farmer survey that covered 6,000 operations in four states, namely Minnesota, Nebraska, North Dakota, and South Dakota, with 1,500 operations in each state. We received 1,119 responses out of 5,473 eligible addresses, indicating a response rate of 20.4% (Wang et al., 2023 a,b). Out of all the survey respondents, 290 are from South Dakota.
The adoption rates and length of usage for different PA technologies among the SD producers, based on our 2021 farmer survey results, are depicted in Figure 2 and Figure 3. When compared to the 2022 census findings, the PA adoption rates are higher in our 2021 survey due to three potential reasons: 1) our surveyed farmers are selected from counties east of the Missouri River to focus on the major crop planting regions; 2) the average farm size in our survey is larger, as each slected farm grew at least 100 acres of corn; 3) farmers who are interested in PA technologies are more likely to respond to our voluntary survey than farmers who are not interested.
Automated Technologies
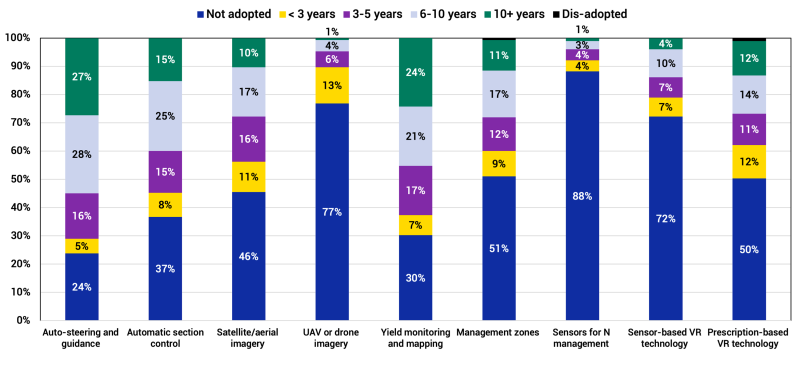
Among all PA practices, auto-steering is the most adopted practice (76%), followed by yield monitoring and mapping (70%), and then automatic section control (63%) (Figure 2). All of these three technologies can be referred to as automated technologies, which require little additional skills. Furthermore, the automated PA technologies have mostly been adopted for more than five years, with reduced adoption rates within the recent five years.
Variable Rate Technologies
In contrast to automated technologies, the use of data technologies, such as VR technologies, requires more skills or training. For VR technologies, the adoption rates have been steadily increasing over the years. Under the VR technology category, prescription-based VR is more widely used in comparison to sensor-based VR technology. About half of the producers used prescription-based VR technology, 28% used sensor-based VR technology, and only 12% used sensors for N management.
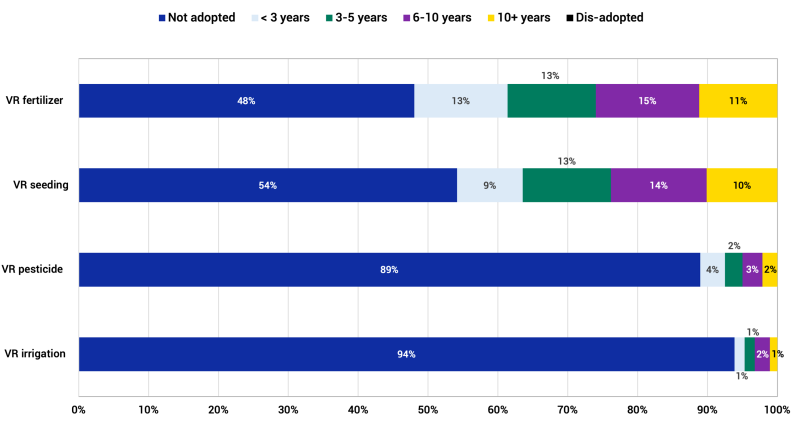
Figure 3 provides SD farmers’ adoption rates and length of usage for different VR technologies. According to Figure 3, 52%, 46%, 11% and 6% of producers used VR fertilizer, VR seeding, VR pesticide and VR irrigation technologies, respectively. This indicates that among the farmers who used VR technology, most used VR fertilizer and VR seeding technologies, while adoptions of VR pesticide and irrigation are much less common.
Summary and Outlook
Overall, our survey findings on PA practices by category indicated that automated technologies are more broadly adopted than data technologies, as the latter require more expertise than the former. Farmers often need to rely on expert advice for data interpretation, zone delineation and VR map generation. Our survey also pointed out that, for farmers who have adopted automated technologies but no data technologies, their top three challenges are high equipment cost, service cost, and brand compatibility. In addition to high upfront cost, technologies not compatible with existing ones, either due to different manufacturer brands or because of hardware and software incompatibility, will pose additional challenges for farmers to adopt (Wang et al., 2023a).
Despite such challenges, the top three most-profitable PA technologies rated by adopters were VR seed application, VR fertilizer application and automatic section control (Wang et al., 2023b). About two-thirds of adopters rated that these three technologies achieved at least a 5% increase in profitability. This suggests that the outlook for VR technology adoption is promising. Promotional efforts could be made to demonstrate the profitability potential of various PA technologies on a regional basis. Connection opportunities between non-adopters and adopters of PA technologies could further facilitate PA adoption to promote the environment and economic sustainability.
References
- U.S. Department of Agriculture (USDA) National Agricultural Statistics Service (NASS) (2022). 2022 Census of Agriculture.
- Wang T., H. Jin, and S. Heidi (2023a). Factors affecting farmer perceived challenges towards precision agriculture. Precision Agriculture.
- Wang T., H. Jin, H. Sieverding, S. Kumar, Y. Miao, O. Obembe, X. Rao, A. Nafchi, D. Redfearn, S. Cheye (2023b). “Understanding farmer views of precision agriculture profitability in the US Midwest.” Ecological Economics, 213, 107950.