Introduction to Soil Tests

Having an adequate level of nutrients in the soil can optimize yield and quality. Sampling soils can measure the level of nutrients and the likelihood that adding fertilizer will increase crop yields. Many different tests are available to measure the level of nutrients that are present in the soil. Nitrogen in the soil is present in organic and inorganic forms whereas phosphorus, potassium and many other nutrients are contained in rocks soil is formed from, inorganic and organic forms. Plants can only take up certain forms of nutrients and the total amount present in the soil is not all plant available.
Determining Nutrient Levels
A list of commonly used extracts to determine soil nitrogen, phosphorous and potassium levels in soil is shown in Table 1. The extractants used include acids, bases, neutral salt solutions and water. The water-soluble or level measured by extraction of most plant nutrients is small compared to the total level present in the soil. The recommended methods to measure nitrogen concentration in South Dakota is the 2 N potassium chloride extract, phosphorous is Olsen method and potassium is the 1 M ammonium acetate extract. Some of the soil phosphorous extractions work better in soils with high pH soils, whereas others work better in low pH soils.
| Nutrient | Extraction Method | Extraction Chemicals Used | Notes | Source |
|---|---|---|---|---|
| Nitrogen | Soil: Water Extract | 1:10 soil: water extract | Extraction used with Haney Soil Health Test | Haney et al., 2006 |
| Nitrogen | Potassium Chloride Extract | 2 N potassium chloride | Most used method | Maynard & Kalra 1993 |
| Phosphorous | Bray1 Extract | 0.0225 N hydrochloric acid and 0.03 N ammonium fluoride | Performs poorly on high pH >7 soils | Bray and Kurtz 1945 |
| Phosphorous | Mehlich 3 Extraction | 0.2 M acetic acid, 0.25 M ammonium nitrate, 0.015 M ammonium fluoride, 0.013 M nitric acid and 0.001 M ethylenediaminetetraacetic acid | Frequently used in Eastern United States in acidic or neutral pH soils | Mehlich 1984 |
| Phosphorous | Haney Extraction | 2 g/l lithium citrate, 0.6 g/l citric acid, 0.4 g/l malic acid and 0.4 g/l oxalic acid. | Used with Haney Soil Health Test | Haney et al., 2010 |
| Phosphorous | Olsen | 0.5 M sodium bicarbonate | Works best in alkaline soils | Olsen et al., 1984 |
| Phosphorous | Morgan Extract | 0.73 N sodium acetate and 0.52 N acetic acid. | Used primarily in Eastern United States | Morgan 1941 |
| Potassium | Ammonium Acetate extract | 1 M ammonium acetate | Commonly used to measure soil cation exchange capacity and base cations | Shuman & Duncan 1990 |
| Potassium | Haney Extraction | 2 g/l lithium citrate, 0.6 g/l citric acid, 0.4 g/l malic acid and 0.4 g/l oxalic acid. | - | Haney et al., 2010 |
| Potassium | Mehlich 3 Method | 0.2 M acetic acid, 0.25 M ammonium nitrate, 0.015 M ammonium fluoride, 0.013 M nitric acid and 0.001 M ethylenediaminetetraacetic acid | - | Mehlich 1984 |
| Potassium | Morgan Extract | 0.73 N sodium acetate and 0.52 N acetic acid. | - | Morgan 1941 |
Nutrient Level Categories
Based upon the soil test value the level of the nutrient can be converted into categories such as low, medium and high. If the level of nutrient is high or very high the chance of fertilizer additions increasing yield is low. However, if the level of nutrient is low or very low the chance that adding nutrients will increase yield is high. The characterization of levels based on SDSU fertilizer recommendations is shown in Table 2. The categorization of nutrient levels can vary based on extraction that is used such as what is shown for the different soil phosphorous and potassium extractions in Table 2.
| Nutrient |
|
|
|
|
|
|---|---|---|---|---|---|
| Likelihood of Yield Response |
|
|
|
|
|
| Phosphorus (Olsen) |
|
|
|
|
|
| Phosphorous (Bray 1) |
|
|
|
|
|
| Potassium (Ammonium Acetate) |
|
|
|
|
|
*Adapted from Clark 2023.
Soil Test Kit Research
There are some inexpensive soil test kits that are available to purchase online. Some of these include Rapitest Soil Test Kit, Dewild Trading Company Soil Test Kit, New Test Soil Test Kit, Lamott Soil Test Kits, Say Summer Soil Test Kit, Pawfly soil test kit. Some of these soil tests were used on soils that were a variety of soil textures, which are shown in Table 3.
Sample Analysis
The previously mentioned soil samples were sent to Ward Laboratory and soil nutrient levels were measured which is shown in Table 3. Also, the level of the nutrients was categorized in levels such as high or low in Table 3. One sample of each soil from a composite sample was sent to the lab and soil pH and nutrient levels were measured. Also soil nutrient levels and pH were determined on one sample of each soil when using the soil test kits. The soils used consisted of a variety of soil textures ranging from sand to clay.
| Soil | Soil Texture | pH | CEC cmole +/ kg | Organic Matter (%) | Nitrogen Concentration (nitrate) (ppm) | Phosphorous (ppm) | Phosphorous level | Potassium (ppm) | Potassium Level |
|---|---|---|---|---|---|---|---|---|---|
| Sparta |
|
|
|
|
|
|
|
|
|
| Krantzburg |
|
|
|
|
|
|
|
|
|
| Renshaw (1) |
|
|
|
|
|
|
|
|
|
| Renshaw (2) |
|
|
|
|
|
|
|
|
|
| Opal |
|
|
|
|
|
|
|
|
|
- Nitrogen + ammonium was determined using 1:10 soil: water extract.
- Nitrate was determined using 2 N KCl extract.
- Phosphorous was determined using Mehlich 3 Extract.
- Phosphorous was measured using the Olsen Method. Potassium levels and cation exchange capacity was measured using 1 M ammonium acetate extract.
Nutrient Recommendations
SDSU has equations that are used to give recommendations for nitrogen, phospohorus and potassium needed for gardens. These equations are listed in the Fertilizer Recommendations Guide (Clark 2023). Based on values received from the lab the recommended fertilizer to be added is shown in Table 4. All of the soils tested had low nitrogen concentration but phosphorous and potassium fertilization is recommended on some but not all soils used (Table 4).
| Soil |
|
|
|
|---|---|---|---|
| Sparta |
|
|
|
| Krantzburg |
|
|
|
| Renshaw (1) |
|
|
|
| Renshaw (2) |
|
|
|
| Opal |
|
|
|
*Values listed are in lbs/ 1000 square feet.
Rapitest Soil Test Kit
When using the Rapitest soil test for measurement of soil pH soil is added to a level in a container and then distilled water is added to fill to a level. Then a pH capsule is added which causes the solution to change color depending upon the soil pH. To measure soil nitrogen, phosphorous and potassium level soil is mixed in a 1:5 soil: water ratio then shook, and soil is allowed to settle. Then water from extract is placed in a container and filled to a level. Then the capsule is added, and color intensity is used to determine the level. Soil pH values were close although the highest level that the container went up to was 7.5. Soil nitrogen levels were low on all soils and the Rapitest showed that the all the soils nitrogen levels were low (Table 5). On soil samples that were sent to the laboratory the level of phosphorus was high on three of the soils and low on two of them. The Rapitest said that phosphorous was deficient on two soils where the lab soil test recommended that phosphorous fertilization was not needed (Table 5). As with phosphorous, the potassium level did not align with all of the laboratory results (Table 5). On the two soils that had very high potassium levels soil potassium levels were sufficient and surplus (Table 5). However, on a soil that had very low potassium levels the Rapitest said the level was sufficient and on one with low potassium level the Rapitest said it was adequate (Table 5). Based on the recommendations from the Rapitest nitrogen fertilization was recommended on all the soils tested which is in agreement with lab tests (Table 5). The Rapitest recommended adding less potassium than was recommended by SDSU recommendation on two of the soils. The Rapitest performed the worst at estimating whether phosphorous fertilization was needed. On three soils where soil test phosphorous levels were high based on laboratory measurement the Rapitest recommended adding phosphorous fertilizer. This may be due to water being used as an extractant instead of chemicals used in table 1. Much of the phosphorous in soil is not water soluble.
| Soil | pH | Nitrogen | Nitrogen to Apply to Root Vegetables | Nitrogen to Apply to Leafy Vegetables | Potassium | Potassium to Apply to Root Vegetables | Potassium to Apply to Leafy Vegetables | Phosphorous | Phosphorous to Apply to Root Vegetables | Phosphorous to Apply to Leafy Vegetables |
|---|---|---|---|---|---|---|---|---|---|---|
| Sparta | 6 | Depleted | 1.41 | 2.86 | Sufficient | 0 | 0 | Adequate | 0.86 | 0.65 |
| Krantzburg | 6.25 | Depleted | 1.41 | 2.86 | Sufficient | 0 | 0 | Deficient | 1.46 | 1.46 |
| Renshaw (1) | 7.5 + | Depleted | 1.41 | 2.86 | Adequate | 0.9 | 0.9 | Adequate | 0.86 | 0.65 |
| Renshaw (2) | 7.5 | Depleted | 1.41 | 2.86 | Deficient | 1.83 | 1.83 | Deficient | 1.46 | 1.46 |
| Opal | 7.5 | Depleted | 1.41 | 2.86 | Surplus | 0 | 0 | Deficient | 1.46 | 1.46 |
*The amount to add is in units of lbs/1000 square feet
Pawfly Soil Test Kit
To measure soil pH and nitrogen with the Pawfly soil kit 2 spoons of soil is added to 25 ml of water and a reagent 3 tablet was added which contains 88% sodium chloride, 5% sodium carboxymethylcullulose and 7% sulfanic acid. Then the test tube was shaken and allowed to settle. Then a strip is placed in the solution which determins the pH and nitrogen level in the soil based on color of the strip. This test characterizes low nitrogen level at 40 mg/kg soil, medium nitrogen at 160 mg/kg soil, and high nitrogen at 320 mg/kg soil. Soil pH was within a unit of what was measured on samples sent to the lab. The nitrogen levels were low in three of the four soils, between low and moderate in one and moderate in another. If soil test shows soil nitrate or nitrate + ammonium) is more than 58 ppm (126 lbs/ acre) there is no nitrogen fertilization needed. The large difference in values between low, medium and high level makes it difficult to determine how much fertilizer to add. This test did estimate that soil N was low in many of the soils although this test did not give a fertilizer recommendation based on level. For measurement of soil potassium and phosphorous a spoonful of soil is placed in a test tube and two tablets containing 75% sodium chloride, 15 % saccharose and 10 % sodium citrate are added to the soil. Then the soil is shaken and allowed to settle out. Some of the water is taken and used to measure phosphorous with a strip whereas another part of the solution is taken from the test tube and placed into a jar and with a KIII reagent tablet. KIII reagent contains 97% lactose anhydrous, 2% sodium chromate and 1% algin. Potassium and phosphorus levels are determined based on color intensity. Low phosphorous level is 8 mg/ kg soil, medium is 20 mg/kg soil and high is 64 mg /kg soil. For potassium levels low is 40 mg/kg soil, medium is 80 mg/kg soil and high is considered to be 160 mg/kg soil. As with the Rapitest the Pawfly test inconsistently estimated phosphorous concentrations in the soil. In the clay soil it underestimated the soil phosphorous concentration whereas in Renshaw 1 where phosphorus level was low in the soil test it said phosphorous level was moderate. The Pawfly test estimated potassium concentration was a little higher than what was measured on the soil test on the Sparta and Renshaw soils. This may be due to different reagents being used with the soil kit compared to standard laboratory methods.
| Soil | pH | Nitrogen | Potassium | Phosphorous |
|---|---|---|---|---|
| Sparta | 5 | Low | Between low and medium | Between medium and high |
| Krantzburg | 6.5 | Low | High | Moderate |
| Renshaw (1) | 8 | Moderate | Moderate | Moderate |
| Renshaw (2) | 7.5 | Between low and moderate | Moderate to high | Low |
| Opal | 7.5 | Low | High | Low |
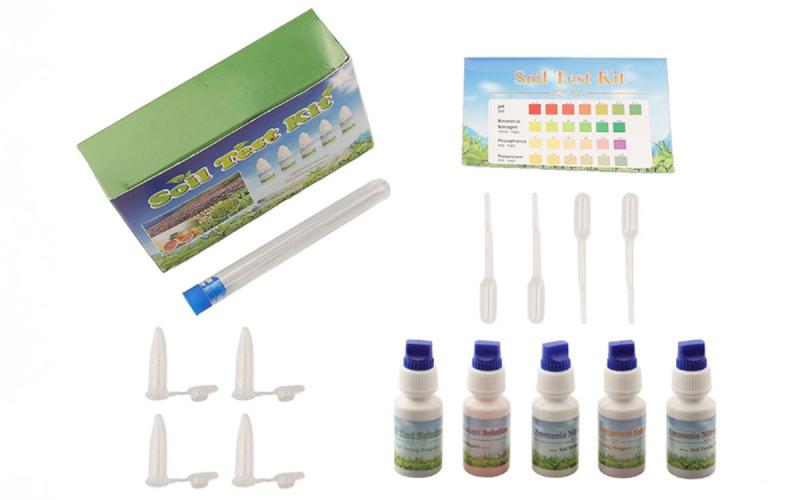
Soil Test Kit Made By Yieri
The soil test kit uses water as an extractant to determine nutrients that are present in the soil and pH. A picture of the kit is shown in Figure 1. Soil is added to the test tube with deionized water and shook. Then the solution is the taken out of the test tube and placed in small test tube. A drop or two of the colorimetric liquid for nutrient is added to the small test tube then color intensity is determined after a period of time.
The scale that is used to interpret the levels of the nutrients is broad. Also, it took longer than the time said on sheet for solution to change color. On all the soils the levels of nutrients estimated did not correlate well with the level that was measured on samples that were sent to the lab (Table 7). The soil test kit overestimated the level of nitrogen and phosphorous on most of the soils used (Table 7). This soil test kit measured ammonium nitrogen instead of nitrate nitrogen that was measured by the other kits. Conventional soil tests frequently measure soil nitrate level which is more correlated to crop yield response than ammonium level. Also, this soil test kit over estimated potassium level on one of the samples but underestimated it on two of the soils. In addition, the pH measured with this kit was within 1.5 units of what was measured on the samples that were sent to the laboratory (Table 7). The other two kits tested did a little better job at estimating pH than this kit. This soil test kit does not give a recommendation of how much fertilizer to add based upon the measured level.
| Soil |
|
|
|
|
|---|---|---|---|---|
| Sparta |
|
|
|
|
| Krantzburg |
|
|
|
|
| Renshaw (1) |
|
|
|
|
| Renshaw (2) |
|
|
|
|
| Opal |
|
|
|
|
*Values for nitrogen, phosphorous and potassium are in mg/l
Lamott NPK Soil Test Kit
The Lamott Soil Test Kit is another kit available to test the level of nutrients available in the soil. When using the Lamotte soil test kit two tablets consisting of 35-40% sodium bisulfate and 25-35% Microcrystalline cellulose is added to 30 ml of water then a heaping spoonful of soil is added. The sample is then shook and soil is allowed to settle out. This soil test kit says soil nitrogen is low at 40 lbs/ acre, medium at 160 lbs/ acre and high at 320 lbs/ acre. This soil test says soil phosphorous is low at 8 lbs/ acre, medium at 20 lbs/ acre and high at 64 lbs/ acre. Also, this soil test says that potassium is low at 40 lbs/ acre, medium at 80 lbs/ acre and high at 160 lbs/ acre. The pounds per acre are for the 0-6 in depth. Multiplying ppm in the soil test x 2 can give you the approximate lbs/ acre of the nutrient that is contained in the soil. This soil test said that soil potassium soil test was high in all soils which did not agree with the laboratory results (Table 8). On a soil that had 60 lbs/ acre and 102 lbs/ acre potassium measured via ammonium acetate extract the LaMotte soil test kit said that the level was high (160 + lbs/ acre) (Table 8). Also, it said soil phosphorous level was medium which does not agree with the level of phosphorus measured on the laboratory soil test for some of the soils (Table 8). Phosphorous levels are in the high range in three of the soils and low in two of the soils on data that was measured on the samples sent to the lab. In addition, the soil test kit said nitrogen level was moderate on two of the soils that does not agree with the low levels that was measured in the laboratory (< 40 ppm). The differences between the LaMotte soil test results and lab soil test results may be due to different extractants being used and the coarse scale for interpreting level based on color of the solution.
| Soil |
|
|
|
|---|---|---|---|
| Sparta |
|
|
|
| Krantzburg |
|
|
|
| Renshaw (1) |
|
|
|
| Renshaw (2) |
|
|
|
| Opal |
|
|
|
Summary
Inexpensive soil test kits are a method available for gardeners available to estimate soil pH and the level of nitrogen, phosphorous and potassium present in the soil. These soil tests kits generally estimated soil pH within a unit of what was measured at the lab. However, these kits inconsistently estimated soil nutrient levels compared to what was measured in the laboratory particularly phosphorous and potassium. This likely is due to soil nitrate being dissolved in soil solution whereas much of the soil potassium in the soil is absorbed on clay and organic matter particles. Also, some of the phosphorous measured using methods such as Bray and Olsen is absorbed to soil particles whereas the level measured using a water extraction is only the amount that is dissolved in soil solution. All of the soil test kits used were inconsistent at estimating the level of nutrients that were contained in the soil and there was not a kit that clearly performed the best. The soil test made by Yieri performed the worst. Only the Rapitest gave fertilizer recommendations based on levels that were measured. The Rapitest recommended nitrogen fertilization on all of the soils but recommended phosphorous fertilization on three soils where level was high. The other kits did not give a fertilizer recommendation rate when levels were low, medium or high. Also, the exact level of nutrient is hard to interpret on these kits due to the color scales and classification of levels being over a wide range. The values for medium and high on some of these kits is above the level where fertilization is not needed based on conventional soil tests. Also, it takes much longer for color to change with these kits than what it says in instructions. In addition, the measured level using the extracting reagents in these kits are not correlated to the likelihood of crop yield response such as the reagents used in Table 1. If gardeners are interested in determining the level of nutrients in their garden it would be better to collect a composite soil sample from garden and send it to a soils testing lab. The soil testing laboratories use extractions that are listed in Table 1 which are correlated to the likelihood that crop yields will increase by adding the nutrient.
References
- Bray R.H., and L.T. Kurtz. (1945). Determination of total, organic and available forms of phosphorus in soils. Soil Sci. 59:39-45.
- Clark, J. (2023). Fertilizer recommendations guide. South Dakota State University Extension. https://extension.sdstate.edu/sites/default/files/2023-06/P-00039-2023-v2.pdf
- Haney, R. L., Haney, E. B., Hossner, L. R., & Arnold, J. G. (2010). Modifications to the new soil extractant H3A-1: A multinutrient extractant. Communications in Soil Science and Plant Analysis, 41(12), 1513-1523.
- Haney, R. L., Haney, E. B., Hossner, L. R., & Arnold, J. G. (2006). Development of a new soil extractant for simultaneous phosphorus, ammonium, and nitrate analysis. Communications in Soil Science and Plant Analysis, 37(11-12), 1511-1523.
- Maynard DG, Kalra YP (1993) Nitrate and exchangeable ammonium nitrogen. In: Carter MR (ed) Soil sampling and methods of analysis. Canadian Society of Soil Science, Lewis Publishers, Boca Raton, Fla., pp 25–37.
- McIntosh, J. L. (1969). Bray and Morgan soil extractants modified for testing acid soils from different parent materials 1. Agronomy Journal, 61(2), 259-265.
- Mehlich, A. 1984. Mehlich 3 soil test extractant: A modification of the Mehlich 2 extractant. Commun. Soil Sci. Plant Anal. 15:1409-1416.
- Morgan, M. F. 1941. Chemical soil diagnosis by the Universal Soil Testing System. Connecticut Agr. Exp. Sta. Bull.450. p. 479-628.
- Olsen, S.R., C.V. Cole, F.S. Watanabe, and L.A. Dean. 1954. Estimation of available phosphorus in soils by extraction with sodium bicarbonate. USDA Circular 939. U.S. Government Printing Office, Washington D.C.
- Shuman, L. M., & Duncan, R. R. (1990). Soil exchangeable cations and aluminum measured by ammonium chloride, potassium chloride, and ammonium acetate. Communications in Soil Science and Plant Analysis, 21(13-16), 1217-1228.