Introduction
Nitrogen (N) is an essential plant nutrient commonly applied to South Dakota (SD) oat crops and is critical for optimizing yield. It is important to apply an appropriate rate of N fertilizer as too low of a rate reduces economic return while too high of a rate can lead to potential negative environmental effects. Common N rate recommendation approaches at this time include the yield goal approach and the maximum return to N (MRTN) approach (Morris et al., 2018).
The yield goal approach was developed in the 1970s and was the main system for creating crop N recommendations until the maximum return to N approach was developed in 2005 (Morris et al., 2018; Sawyer et al., 2006). One of the greatest strengths of the yield goal approach is simplicity, but that simplicity is likely not able to account for some of the challenges in using the yield goal approach, including being able to estimate yield, internal corn plant N efficiency (i.e., lbs N/bu corn) and other fertilizer use efficiency factors at the beginning of the season (Morris et al., 2018). The MRTN approach determines N rate recommendations based on N response curves from N rate studies conducted in each state or region within a state and is continually updated with new research data. Some of the advantages of the MRTN approach are the ability to incorporate economics into the N recommendation and group sites by different criteria that can influence N response like previous crop, soil type, location, or tillage practice. Some potential disadvantages of the MRTN approach include not accounting for residual N that is especially important in drier climates, the inability to tailor a recommendation for an individual field or zone within a field, and it is often difficult to estimate the price of corn and fertilizer as the selling of corn and purchasing of fertilizer are often at different times of the year. Thus, both approaches have their advantages and disadvantages. South Dakota currently uses a yield goal-based system to determine N fertilizer recommendations. The purpose of this fact sheet is to evaluate the accuracy of both approaches in accurately estimating N fertilizer needs of an oat crop.
Materials and Methods
Twenty-eight oat N rate response trials were conducted at field locations across central and eastern SD from 2017-2022. Site locations varied in tillage practice, crop rotation, and soil type. Specifically, 9 were in conventional till and 19 in no-till fields. The previous crop was soybean at 25 locations, and corn at 3 locations. Nitrogen fertilizer was applied before planting at rates from 0 to 150 lbs N ac-1. Nitrogen fertilizer as urea (46-0-0) was broadcast on the soil surface. Fertilizer was incorporated if conventional tillage practices were used or remained on the soil surface when no tillage was used. Soil samples were collected before planting and fertilizer application from the 0-6 and 6-24 in. depth increments and analyzed for nitrate-N (Nathan et al., 2015). Oat grain yield was determined by harvesting the center five feet of each plot and adjusting grain weight to 13% moisture.
Economic optimal N rates (EONR) were determined by modeling the relationship between oat yield and N fertilizer rate by averaging the results from both the linear-plateau and quadratic-plateau models using a N fertilizer price to oat price ratio of 0.12 (Miguez & Poffenbarger, 2022). The oat price was $3.60/bu oat and $0.42/lb N. If no plateau was reached within the N rates used in the study, the economic optimal N rate was set to the maximum N rate used at that location. For the yield goal approach, the following recently updated equation was used:
N fertilizer rate = Oat yield potential × 0.9 lbs N/bu - Soil Test N - 30 lbs N/ac Legume Credit (oat following soybean)
The 28 site-years of response trials were input into a database developed by John Sawyer at Iowa State University (Sawyer et al., 2006). This spreadsheet was used to calculate a maximum return to N (MRTN) rate. The accuracy of the N recommendation for the yield goal and MRTN approaches was calculated by subtracting the actual EONR from the predicted EONR. The closer these numbers were to 0, the more accurate the recommendation. If numbers were positive, it meant an over application of N was recommended while negative numbers meant an under application of N was recommended. The mean, median, lower 25th quartile, upper 75th quartile and RMSE values were calculated to help in comparing the accuracy of each N recommendation approach.
Results and Discussion
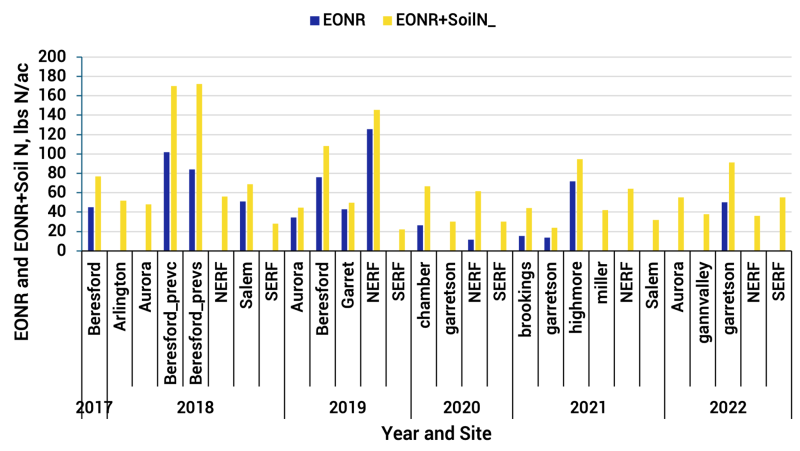
Across the 28 locations, maximum oat yields ranged from 65 to 162 bu/ac with an average of 100 bu/ac while the optimal fertilizer-N rate ranged from 0 to 125 lbs N/ac with an average of 27 lbs N/ac (Figure 1). The optimal fertilizer-N rate + soil test N from the top 2 ft. ranged from 22 to 172 lbs N/ac with an average of 64 lbs N/ac.
Yield Goal Approach
The N fertilizer rate equation accuracy was assessed by taking the recommended N rate calculated from the yield goal approach and then subtracting that from the actual rate needed at each location. The closer these numbers were to 0, the more accurate the recommendation. If numbers were positive, it meant an over application of N was recommended while negative numbers meant an under application of N was recommended. Across all locations, using the yield goal method, the accuracy ranged between -136 and +63 lbs N/ac (Figure 2 and Table 1). On average, there was a mean under application of one lb N/ac with the middle 50% of the data ranging between -18 and +25 lbs N/ac. accuracy
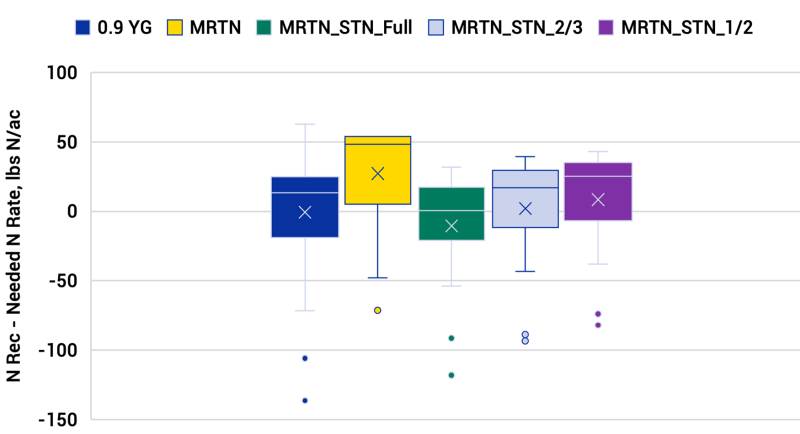
*Note: Figure 2 shows the accuracy of N fertilizer recommendations across all sites using yield goal approach (0.9 YG) and three maximum return to N (MRTN) methods where MRTN alone was used or the full (MRTN_STN_Full), 2/3 (MRTN_STN_2/3), or 1/2 (MRTN_STN_1/2) amount of the soil test N (2 ft. depth) was subtracted from the initial MRTN value. Accuracy as shown by the Y axis is determined by taking the N recommendation calculated using each method and subtracting it from the N fertilizer rate needed at each location. Values closest to 0 are most accurate. Values above 0 are over applications and values below 0 are under applications. The box midline represents the median, the ‘x’ marks the mean, the upper and lower edges of the box represent the 25th to 75th percentiles, the whiskers represent the range of data within 1.5 times the middle 50% of data, and points beyond the whiskers represent points beyond that.
MRTN Approach
The MRTN for the state of SD at a N price $0.42 and an oat price of $3.60/bu was 54 lbs. N/ac. Using the MRTN across all locations led to a mean accuracy of +27 lbs N/ac, demonstrating that using the MRTN would normally lead to over applying N fertilizer (Figure 2 and Table 1). However, subtracting soil nitrate-N in the top two feet improved the accuracy of the MRTN method. For example, subtracting 1/2 of the N led to a median accuracy of +25 lbs N/ac, subtracting 2/3 of the N had an accuracy of +17 lbs N/ac, and subtracting the full soil test value had an accuracy of +0.5 lbs N/ac. These results indicate that the MRTN approach is most accurate when subtracting soil test N (full 2 ft.) from the initial 54 lbs N/ac recommendation, demonstrating that accounting for soil test N is an important step in making recommendations for N fertilizer rates for oats.
Yield Goal vs. MRTN
Compared to the yield goal approach, the MRTN method alone was less accurate by 45 lbs N/ac (Figure 2 and Table 1). However, once soil test N was subtracted from the initial MRTN recommendation both the yield goal approach and MRTN approaches had similar accuracy. Therefore, both methods can be used reliably when soil test N is incorporated into the recommended rate value.
| Statistic | YG @ 0.9 | MRTN | MRTN STN Full | MRTN STN 2/3 | MRTN STN 1/2 |
|---|---|---|---|---|---|
| Min | -146 | -71 | -91 | -93 | -81 |
| Max | 57 | 54 | 30 | 39 | 43 |
| Mean | 31 | 41 | -10 | 2 | 8 |
| Median | 3 | 48 | 1 | 17 | 25 |
| 75th quartile | 16 | 54 | 18 | 30 | 35 |
| 25th quartile | -28 | 5 | -21 | -11 | -7 |
| RMSE | 31 | 41 | 27 | 30 | 32 |
Equations Used
- Yield Goal Approach
N fertilizer rate = Oat yield potential × 0.9 lbs N/bu - Soil Test N - 30 lbs N/ac Legume Credit (oat following soybean) - MRTN Approach
N fertilizer rate = 54 lbs N (MRTN starting value) - Soil Test N (0-24 in. depth)
Conclusions
- Compared to the yield goal approach, the MRTN method alone was less accurate by 45 lbs N/ac.
- When soil test N (0-24 in) was subtracted from the initial MRTN recommendation, both the yield goal and MRTN approaches had similar accuracy.
- When soil test N is incorporated into the N recommendation, both the yield goal and MRTN methods can be used reliably.
References
- Miguez, F. E., & Poffenbarger, H. (2022). How can we estimate optimum fertilizer rates with accuracy and precision? Agricultural and Environmental Letters, 7(1), 1–5.
- Morris, T. F., Murrell, T. S., Beegle, D. B., Camberato, J. J., Ferguson, R. B., Grove, J., Ketterings, Q., Kyveryga, P. M., Laboski, C. A. M., McGrath, J. M., Meisinger, J. J., Melkonian, J., Moebius-Clune, B. N., Nafziger, E. D., Osmond, D. L., Sawyer, J. E., Scharf, P. C., Smith, W., Spargo, J. T., … Yang, H. (2018). Strengths and limitations of nitrogen rate recommendations for corn and opportunities for improvement. Agronomy Journal, 110, 1–37.
- Nathan, M. V, Gelderman, R., Joern, B., Mallarino, A., Mengel, D., Dahl, J., Kaiser, D., Shaver, T., Franzen, D., Culman, S., & Peters, J. (2015). Recommended chemical soil test procedures for the North Central Region. North Central Regional Publication, no. 221 (R.
- Sawyer, J. E., Nafziger, E., Randall, G. W., Bundy, L., Rehm, G., & Joern, B. (2006). Concepts and rationale for regional nitrogen rate guidelines for corn. PM 2015. Iowa State Univ. Ext., Ames.
Acknowledgement
Research funded by the SD Nutrient Research and Education Council and NIFA Hatch project SD000H676-18.