Written by Jack Davis, former SDSU Extension Crops Business Management Field Specialist.
2016 Agricultural Land Values
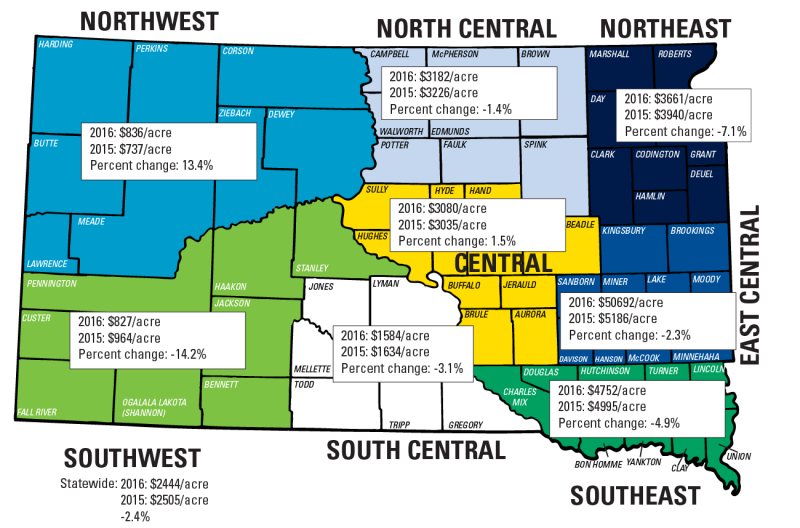
From 1991 to 2015, agricultural land values in South Dakota, and in most other major agricultural production states, appreciated each year. In 2016 on average all agricultural use land decreased in South Dakota except rangeland, which will be discussed in a future article. This is the first annual decline in the average value of agricultural ground compared to yearly increases of 1.4 to 33.6 percent during 2011-2015 (Table 1). This indicates a change from the previous cycle of increases in agricultural land values.
| SE | E. Cent. | NE | N. Cent. | Cent. | S. Cent. | SW | NW | STATE | |
|---|---|---|---|---|---|---|---|---|---|
| Year | Avg. Value (Dollars per acre) | ||||||||
| 2016 | 4752 | 5069 | 3661 | 3182 | 3080 | 1584 | 827 | 836 | 2444 |
| 2015 | 4995 | 5186 | 3940 | 3226 | 3035 | 1634 | 964 | 737 | 2505 |
| 2014 | 5385 | 5763 | 3962 | 3319 | 2931 | 1461 | 620 | 512 | 2470 |
| 2013 | 4954 | 5504 | 3684 | 3217 | 2678 | 1294 | 606 | 536 | 2328 |
| 2012 | 4014 | 3890 | 2587 | 2325 | 2257 | 917 | 461 | 369 | 1742 |
| 2011 | 2900 | 3332 | 2274 | 1720 | 1450 | 781 | 459 | 342 | 1374 |
| Annual % change | |||||||||
| 16/15 | -4.9% | -2.3% | -7.1% | -1.4% | 1.5% | -3.1% | 14.2% | 13.4% | -2.4% |
| *All Ag Land (nonirrigated) | |||||||||
Agricultural Land Demand
The amount of land devoted to production agriculture in South Dakota is fixed and has changed little during the last 26-years. The image above shows that regionally, the change in value varied from a 13.4 percent increase in the Northwest, to a 14.2 percent decrease in the Southwest. Many factors influence the demand for agricultural land in states such as South Dakota, such as interest rates, price expectations, and demand for commodities just to name a few.
Looking Forward
There have been sharp declines in crop prices and returns in the past year. The drop in commodity prices from 2014 to 2016 may be a reason all South Dakota agricultural land values on average decreased 2.4% compared to a year ago (Table 1).
The changes in South Dakota’s agricultural land indicate land values are beginning to come in line with commodity market changes taking place over the last couple of years. Given the current market situation and the expectation of lower commodity and livestock prices in the coming year there is an expectation for agricultural land values to continue decreasing in the next year.
For additional information view South Dakota Agricultural Land Market Trends, 1991 – 2016.
Disclaimer: The information in this article is believed to be reliable and correct. However, no guarantee or warranty is provided for its accuracy or completeness. This information is provided exclusively for educational purposes and any action or inaction or decisions made as the result of reading this material is solely the responsibility of readers. The author(s) and South Dakota State University disclaim any responsibility for loss associated with the use of this information.