This report summarizes recent trends in the Conservation Reserve Program (CRP), harvested hay acreage, and grazing capacity in the United States and South Dakota. The purpose is to give a current picture of conservation enrollment and forage supply. As cropland exited CRP it has transitioned to annual row crops, changing the source of forage-based feedstuffs.
National Trends
The Conservation Reserve Program (CRP) is a federal voluntary land conservation initiative administered by the USDA Farm Service Agency (FSA). Established under the Food Security Act of 1985, the program pays agricultural landowners and operators annual rental payments in exchange for removing environmentally sensitive cropland from production and planting it with long-term, resource-conserving vegetation such as grasses, trees, and wildlife habitat.
Conservation Reserve Program Trends, 1986-2025
The program operates on 10–15-year contracts, during which enrolled land must remain out of crop production (Rosenberg et al. 2024). In return, participants receive annual rental payments, cost-share assistance for establishing permanent vegetative cover, and technical assistance from USDA Natural Resources Conservation Service (NRCS). Initially, CRP was designed to reduce soil erosion of the highly erodible cropland. Over time, CRP expanded its focus on other environmental issues such as wildlife habitat, water quality, and air quality (Fuller et al. 2026). Agricultural producers can enroll environmentally sensitive land in CRP through one of the three signups: General, Continuous, and Grassland. Grassland CRP was authorized in the 2014 Farm Bill, and its first signup started in late 2015.
Figure 1 shows a sharp increase in CRP enrollment during the program’s early years, rising from about 2 million acres in 1986 to approximately 35 million acres by the late 1980s and early 1990s. Total CRP enrollment then declined slightly, falling to about 30 million acres between 1995 and 1999, before rising again and reaching a peak of roughly 36.7 million acres in 2007. Since then, total CRP enrollment declined substantially, dropping to around 20 million acres—a 45% decrease from the 2007 peak.
In recent years, enrollment has begun increasing again; however, most of this growth has come from Grassland CRP enrollment. Grassland CRP first appears in FSA enrollment data in 2017. The subprogram was authorized in 2014 with the initial signup in 2015.
As of September 2025, total CRP enrollment in the United States stands at approximately 25.8 million acres (U.S. Department of Agriculture, Farm Service Agency 2025).
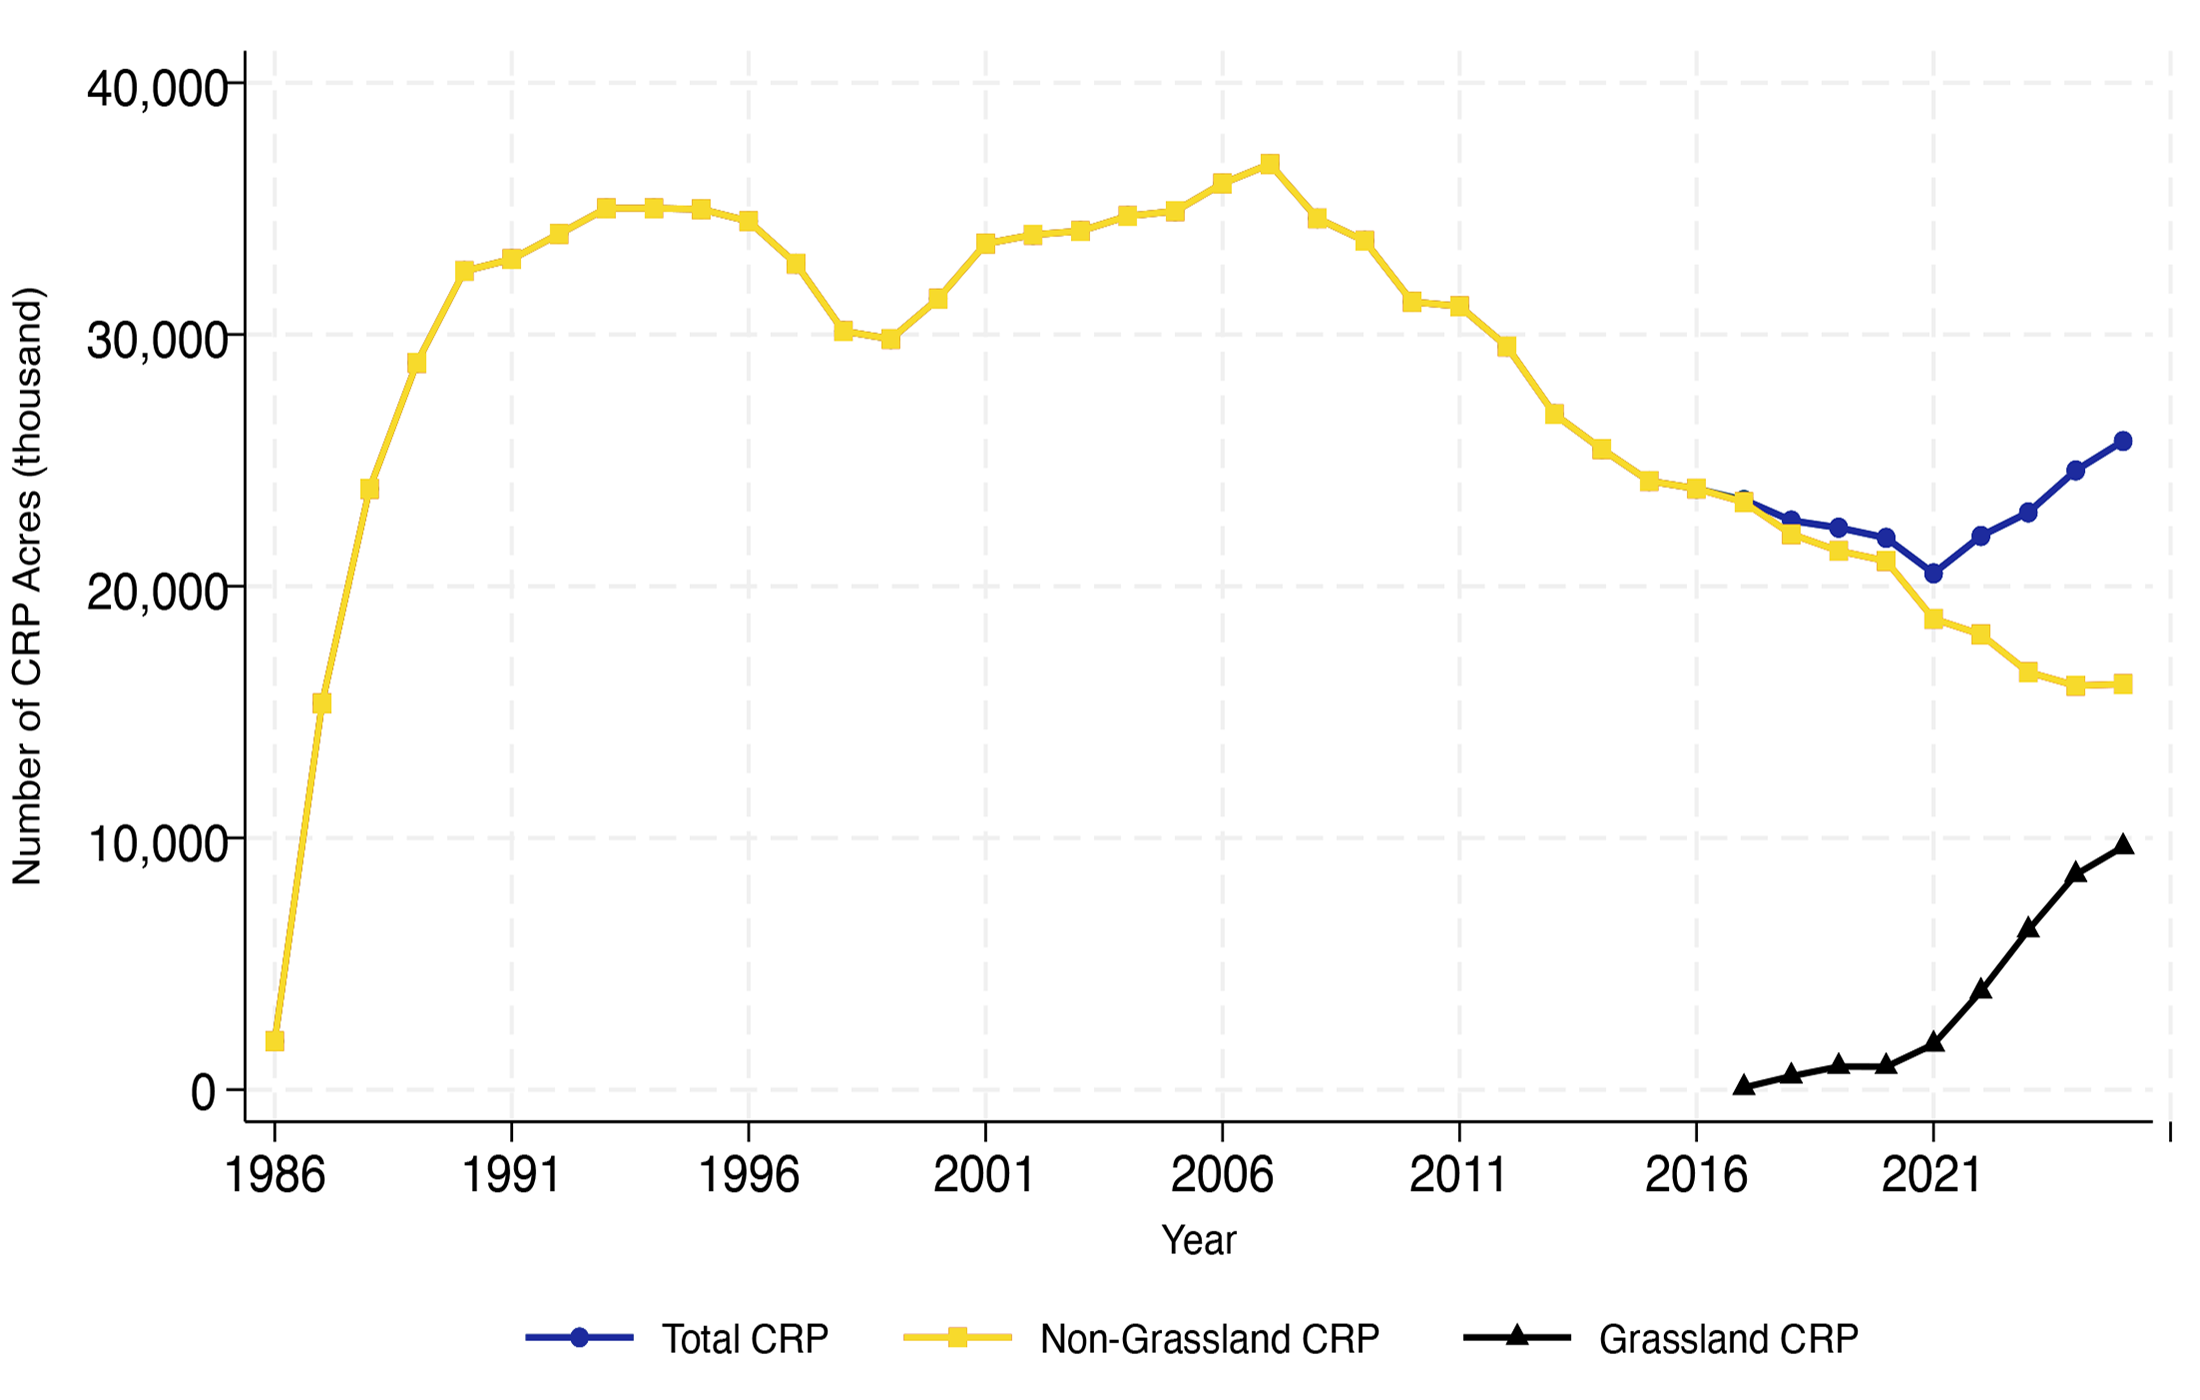
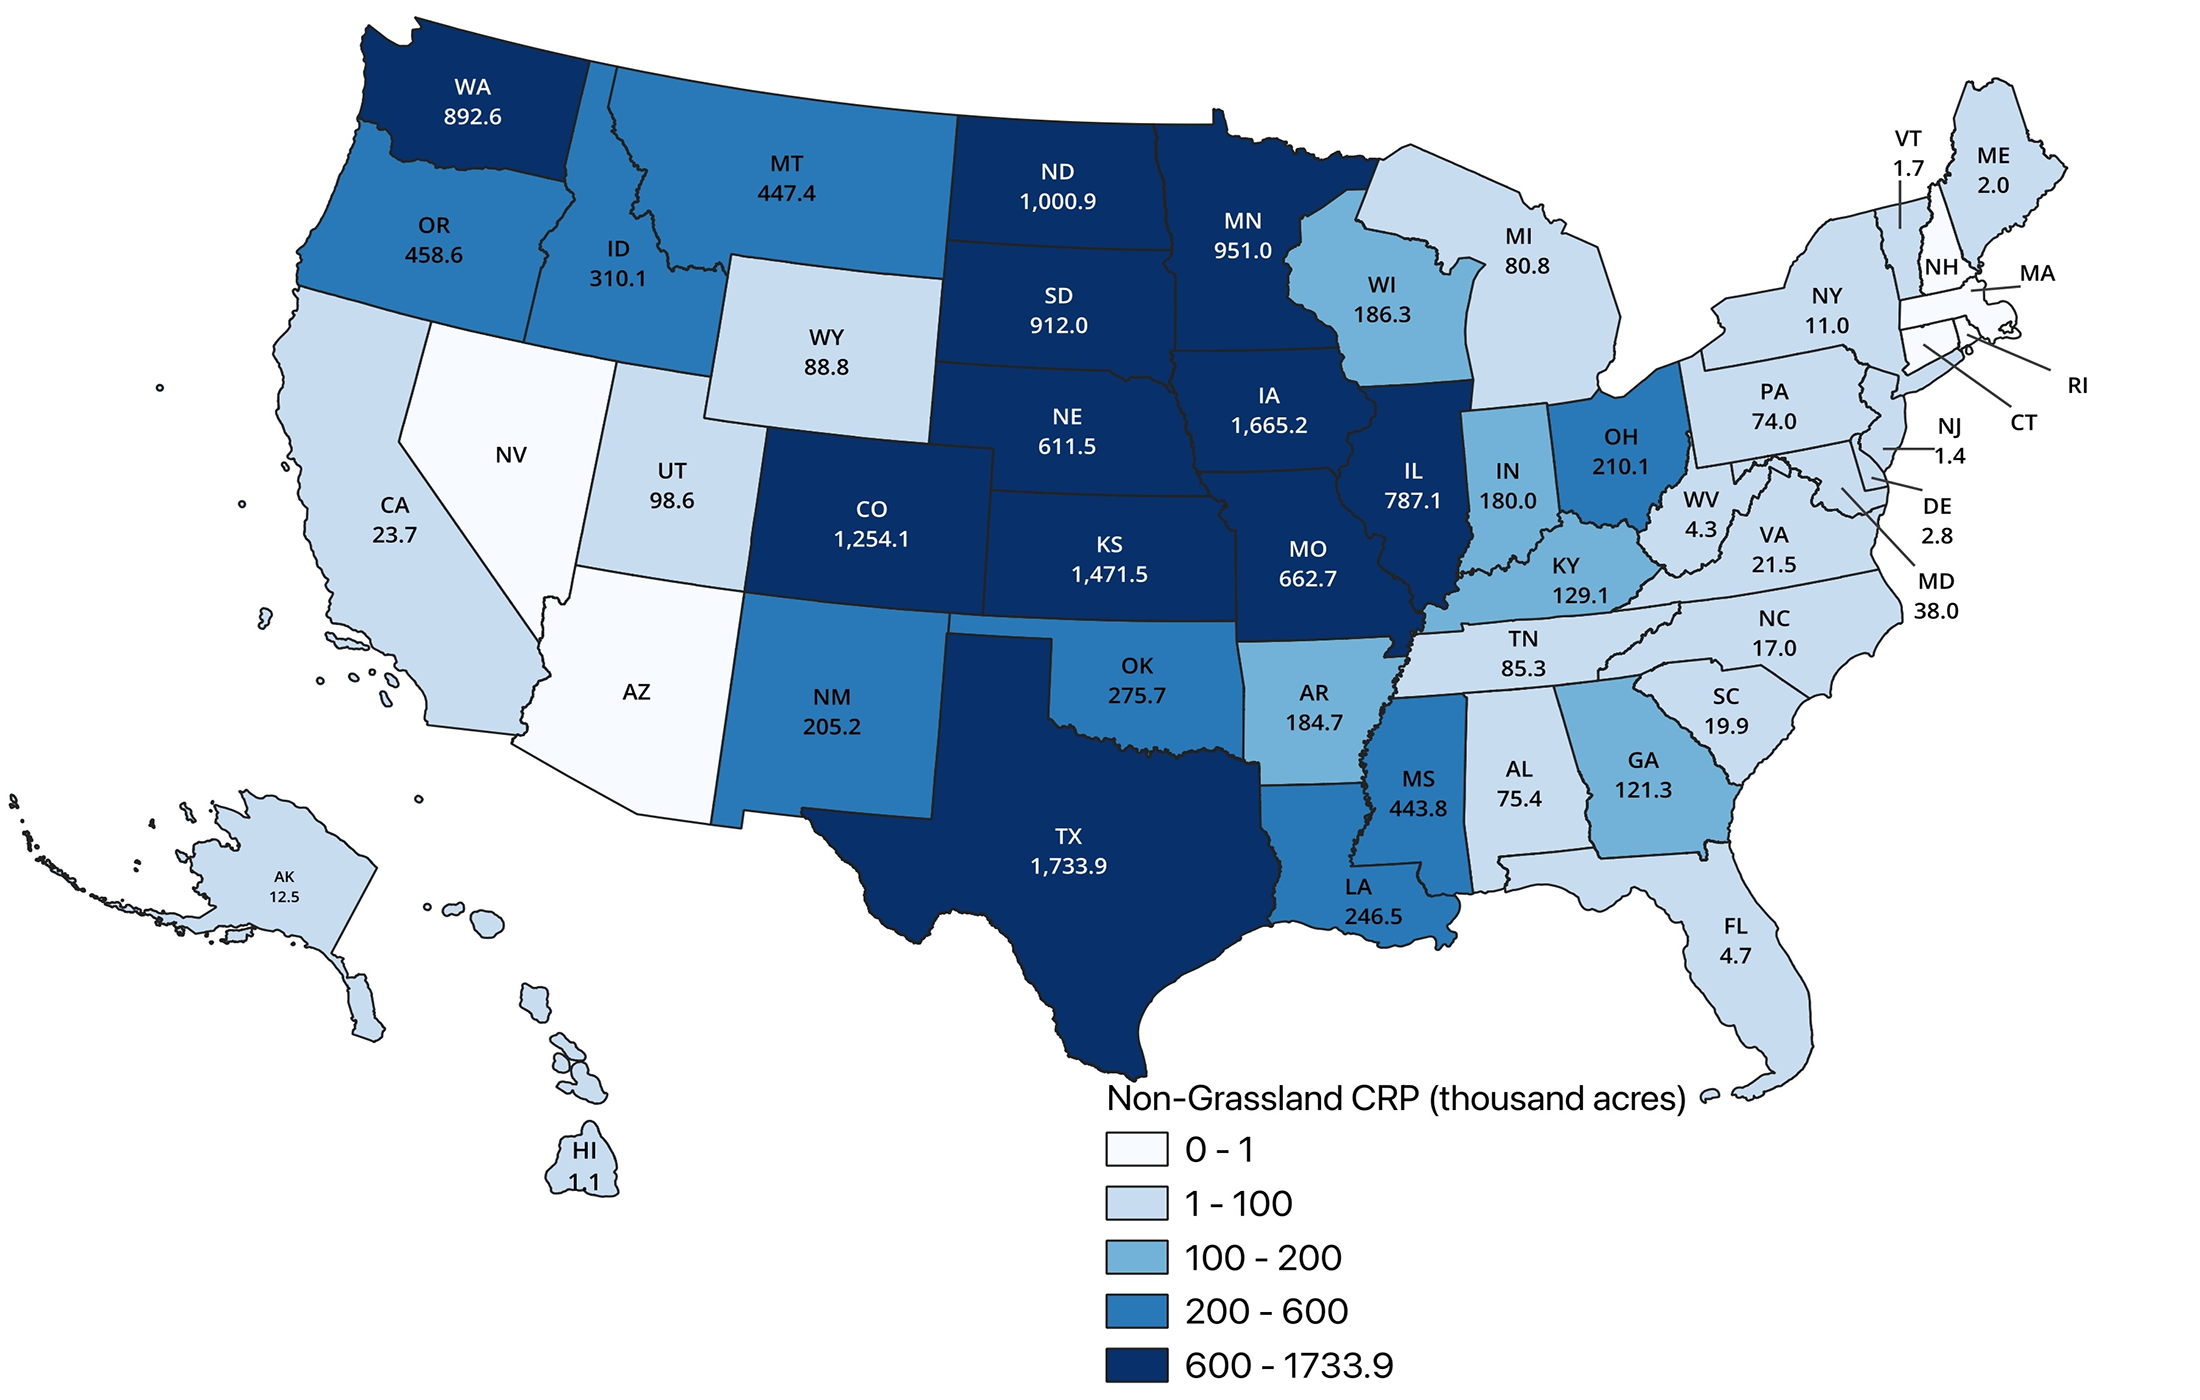
Figure 2 shows non-grassland CRP enrollment by state as of September 2025, measured in thousands of acres. Non-grassland CRP acres are concentrated in the Great Plains and Corn Belt regions with the highest enrollment in states such as Texas (1,733.9), Iowa (1,665.2), Kansas (1,471.5), Colorado (1,254.1), and North Dakota (1,000.9). States in other areas, such as Washington and Mississippi, also report relatively large non-grassland CRP acreages. In contrast, non-grassland CRP enrollment is much lower in many eastern, southeastern, and southwestern states.
Harvested Hay Acres
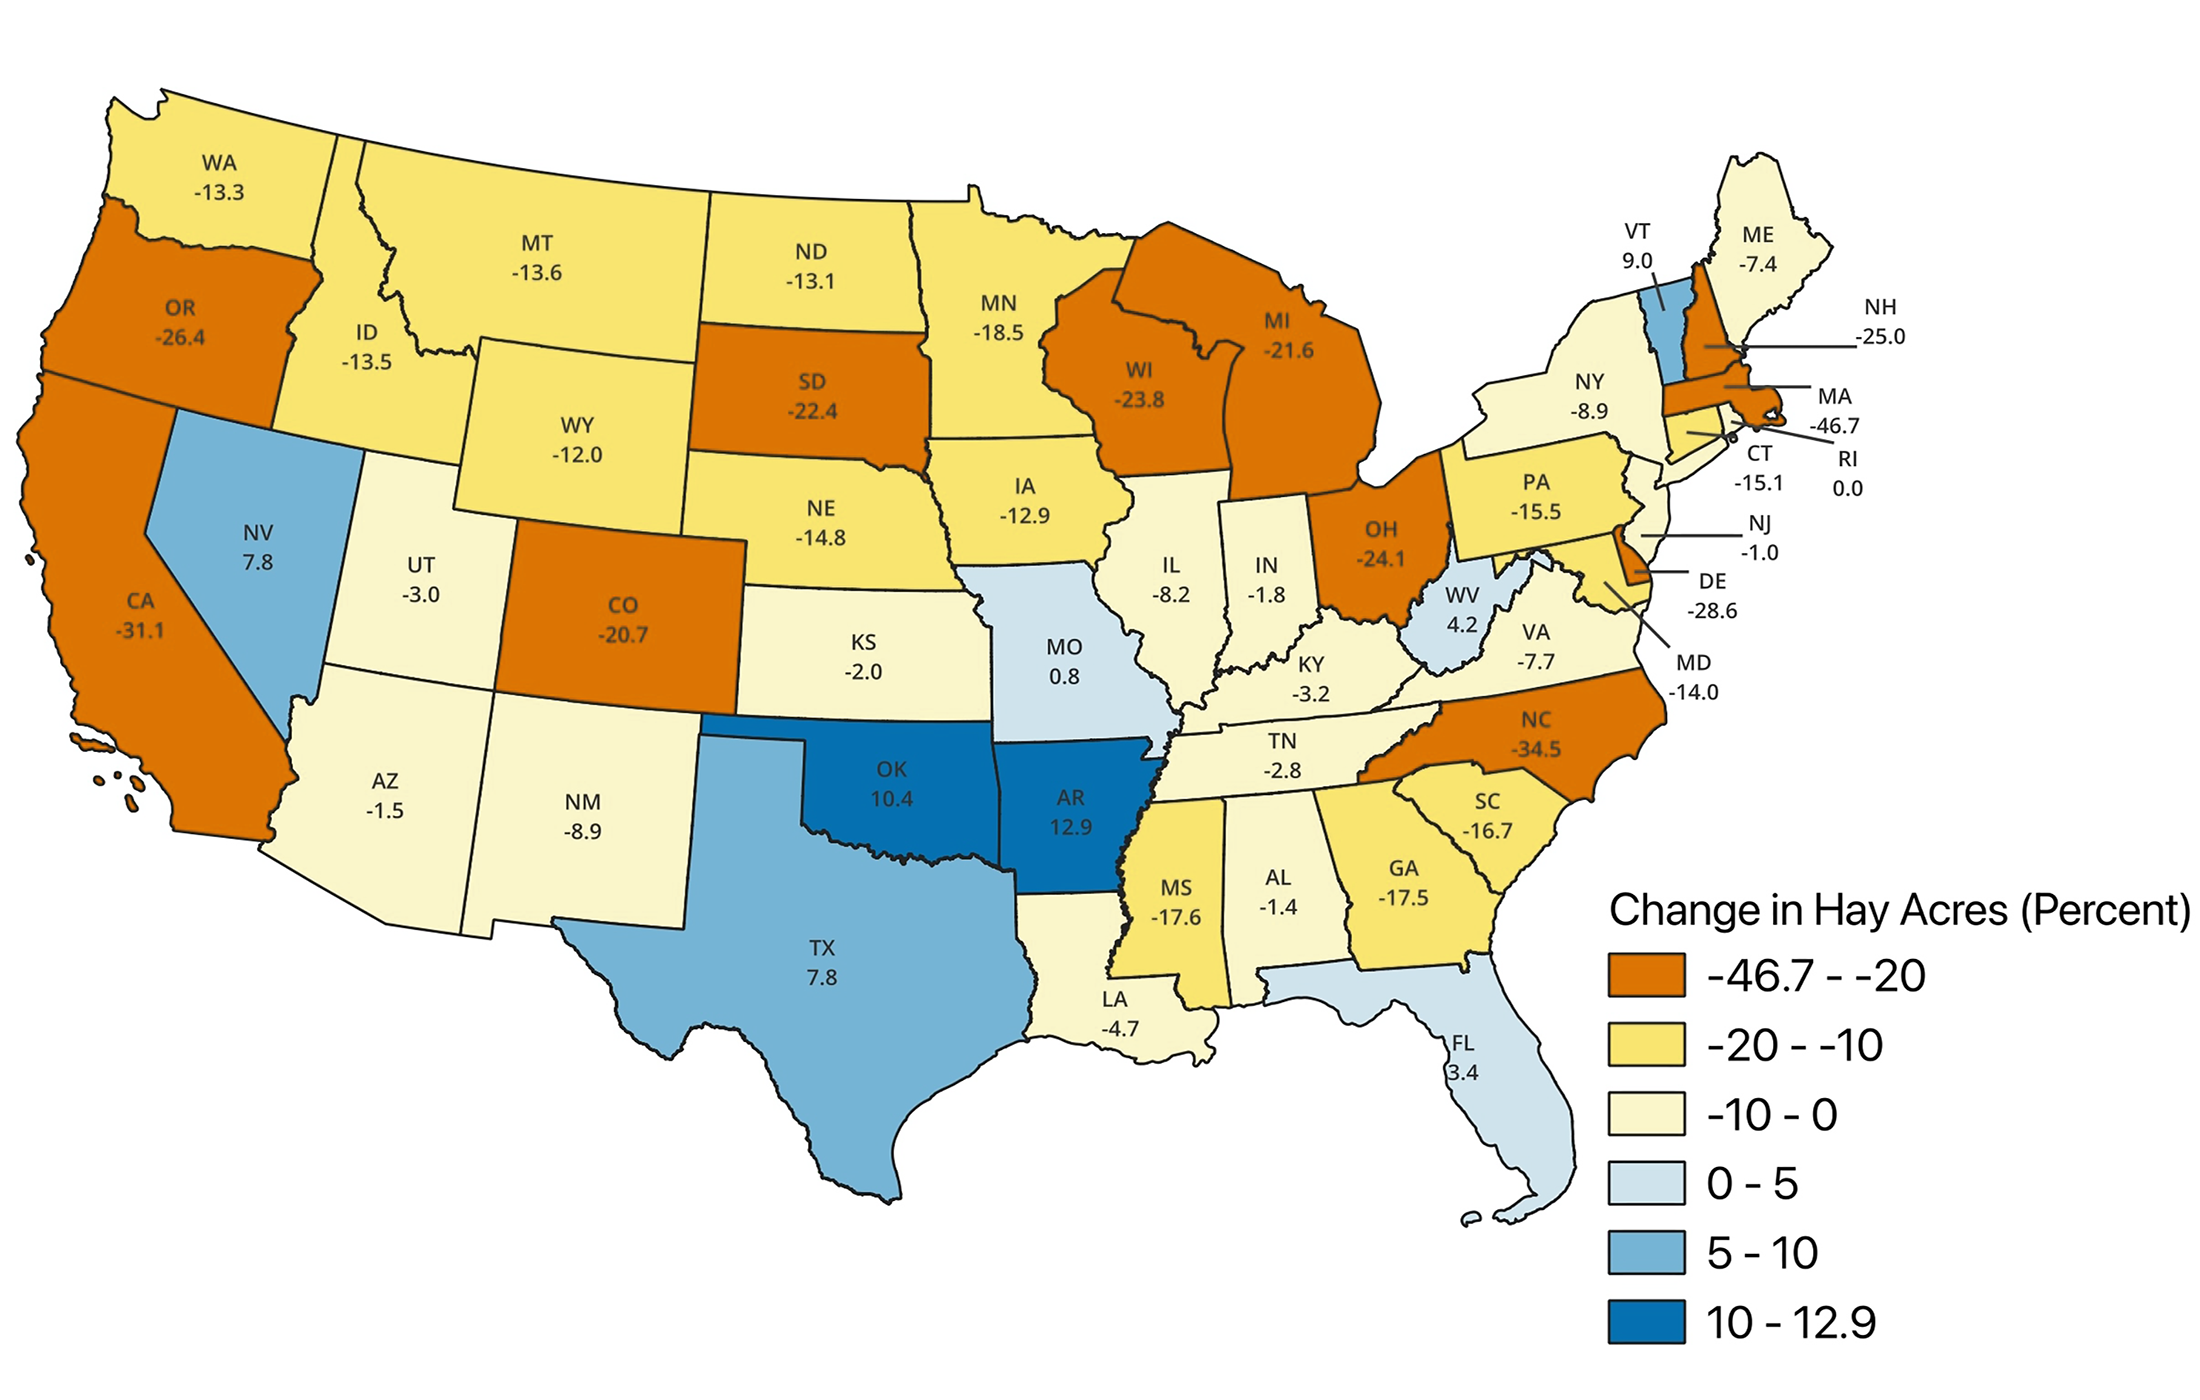
The decline in CRP acres coincided with a decline in harvested hay acres. Figure 3 illustrates changes in harvested hay acreage at the state level between 2015 and 2025. Several states, including California, Oregon, South Dakota, Ohio, Wisconsin, and Michigan, experienced the largest declines, with harvested acreage falling by more than 20 percent over the period. Additional major hay-producing states—including Washington, Idaho, Montana, Iowa, Minnesota, North Dakota, and Nebraska—experienced declines ranging from 10 to 20 percent. Overall, most U.S. states experienced a reduction in harvested hay acreage during the decade.
This decline in hay harvested acres has occurred along with the decline in the U.S. cattle and calves inventory, as illustrated in Figure 4, which shows total U.S. cattle and calves inventory (left axis, thousand head) along with total hay acres (right axis, thousand acres) from 1986 to 2025. Both series exhibit cyclical fluctuations consistent with cattle market cycles, but each also follows a generally downward long-run trend over the 40-year period.
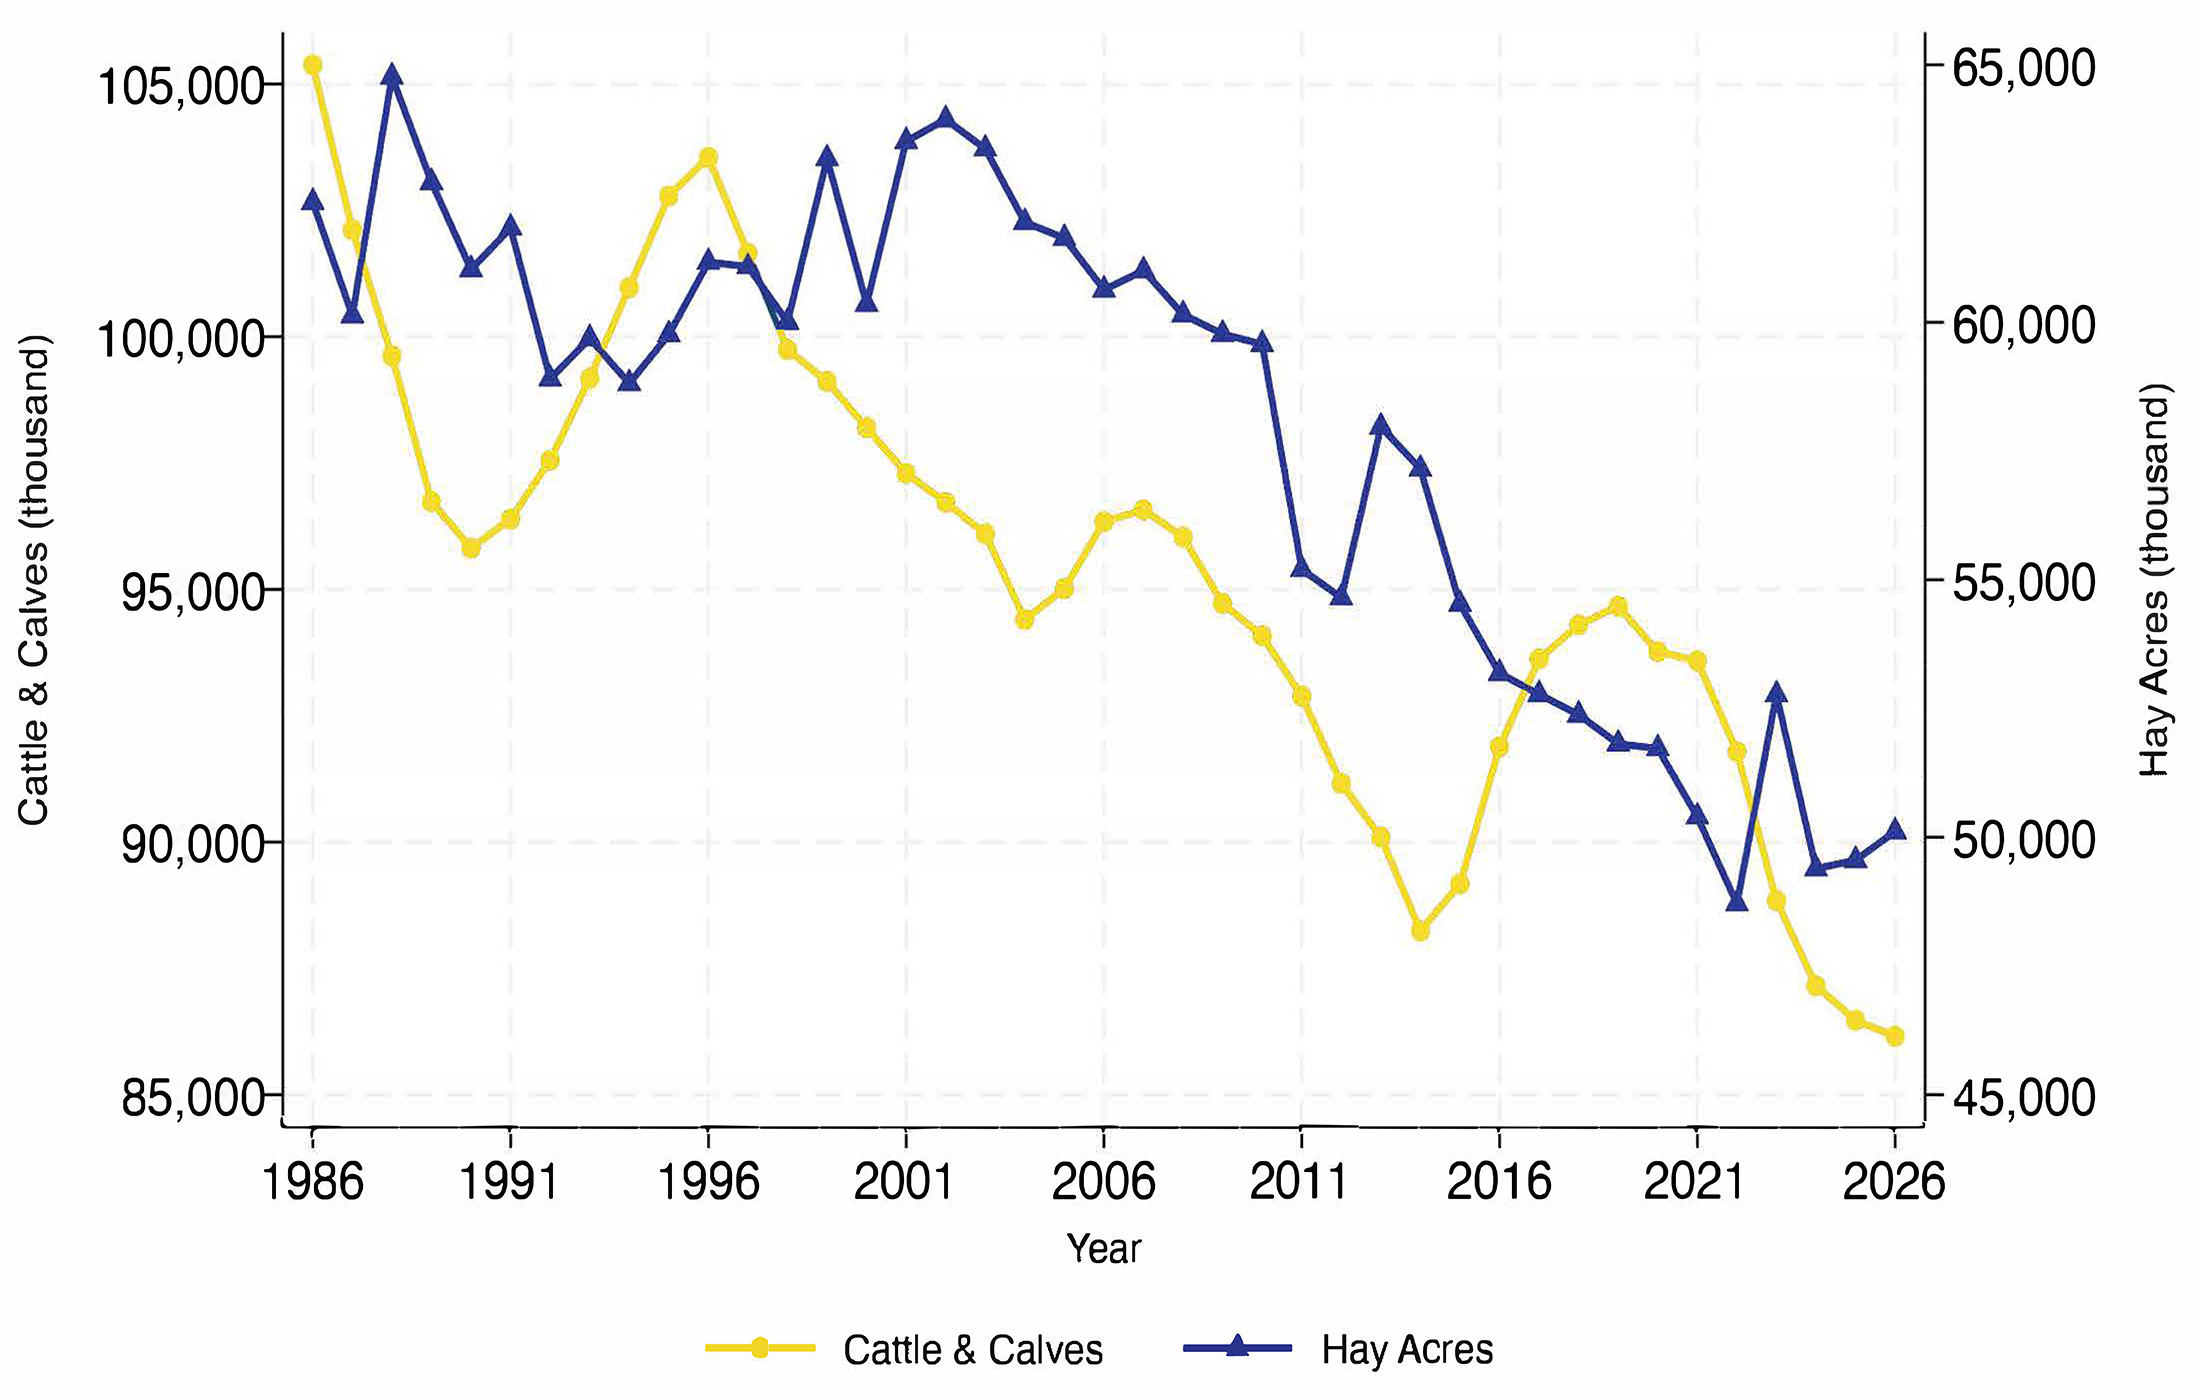
Cattle and calves inventory reached cyclical peaks in 1986 and 1996 before entering repeated periods of contraction. Hay acreage follows a similar pattern but exhibits a more pronounced declining trend, decreasing from more than 60 million acres in the late 1980s to approximately 50 million acres in recent years. The parallel downward movement of these hay harvested acres and total cattle and calves suggests a long-run relationship between the size of the U.S. cattle herd and the amount of land devoted to hay production.
South Dakota Trends
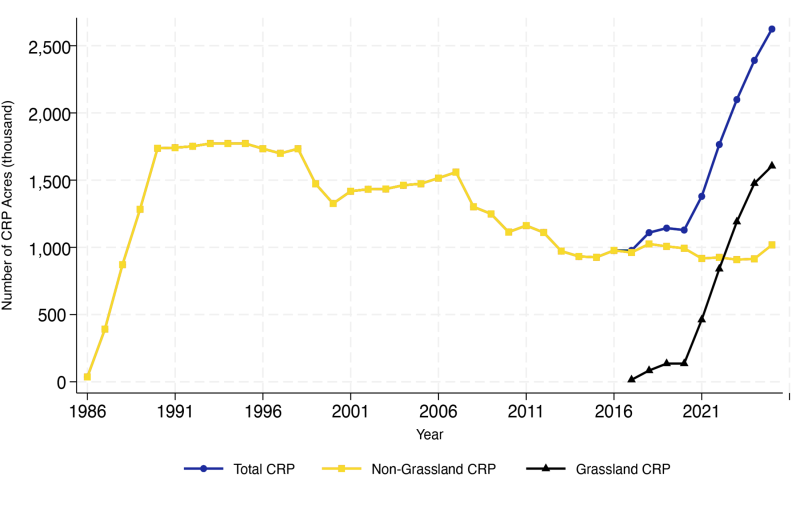
The trends in CRP and hay acres in South Dakota follow the national patterns. Figure 5 shows the CRP enrollment acres from 1986 to 2025 in South Dakota. CRP enrollment increased sharply from near zero in 1986 to roughly 1.8 million acres by the early 1990s, then declined gradually through the late 1990s and early 2000s, bottoming out around 1 million acres before rising again through the mid-2000s. After a modest decline in the early 2010s, CRP enrollment rose dramatically after 2017, surpassing 2.6 million acres by 2025.
The increase in total CRP acres since 2017 largely comes from grassland CRP enrollment while the non-grassland CRP enrollment remained relatively stable since 2013. As of 2025, South Dakota has approximately 2.6 million acres enrolled in CRP. Among these, around 1.6 million acres are grassland CRP and approximately 1 million acres are non-grassland CRP.
Figure 6 shows county-level non-grassland CRP enrollment for 2025 in thousands of acres. Non-grassland CRP enrollment is concentrated in the central and northeast regions of the state, with Brown County recording the highest level at 75.7 thousand acres, followed by Day (43.3), Marshall (42.4), Roberts (39.9), Spink (36), Lyman (34.8), and Beadle (31.5) counties. In contrast, the southeastern and western parts of the state have lower non-grassland CRP enrollment levels.
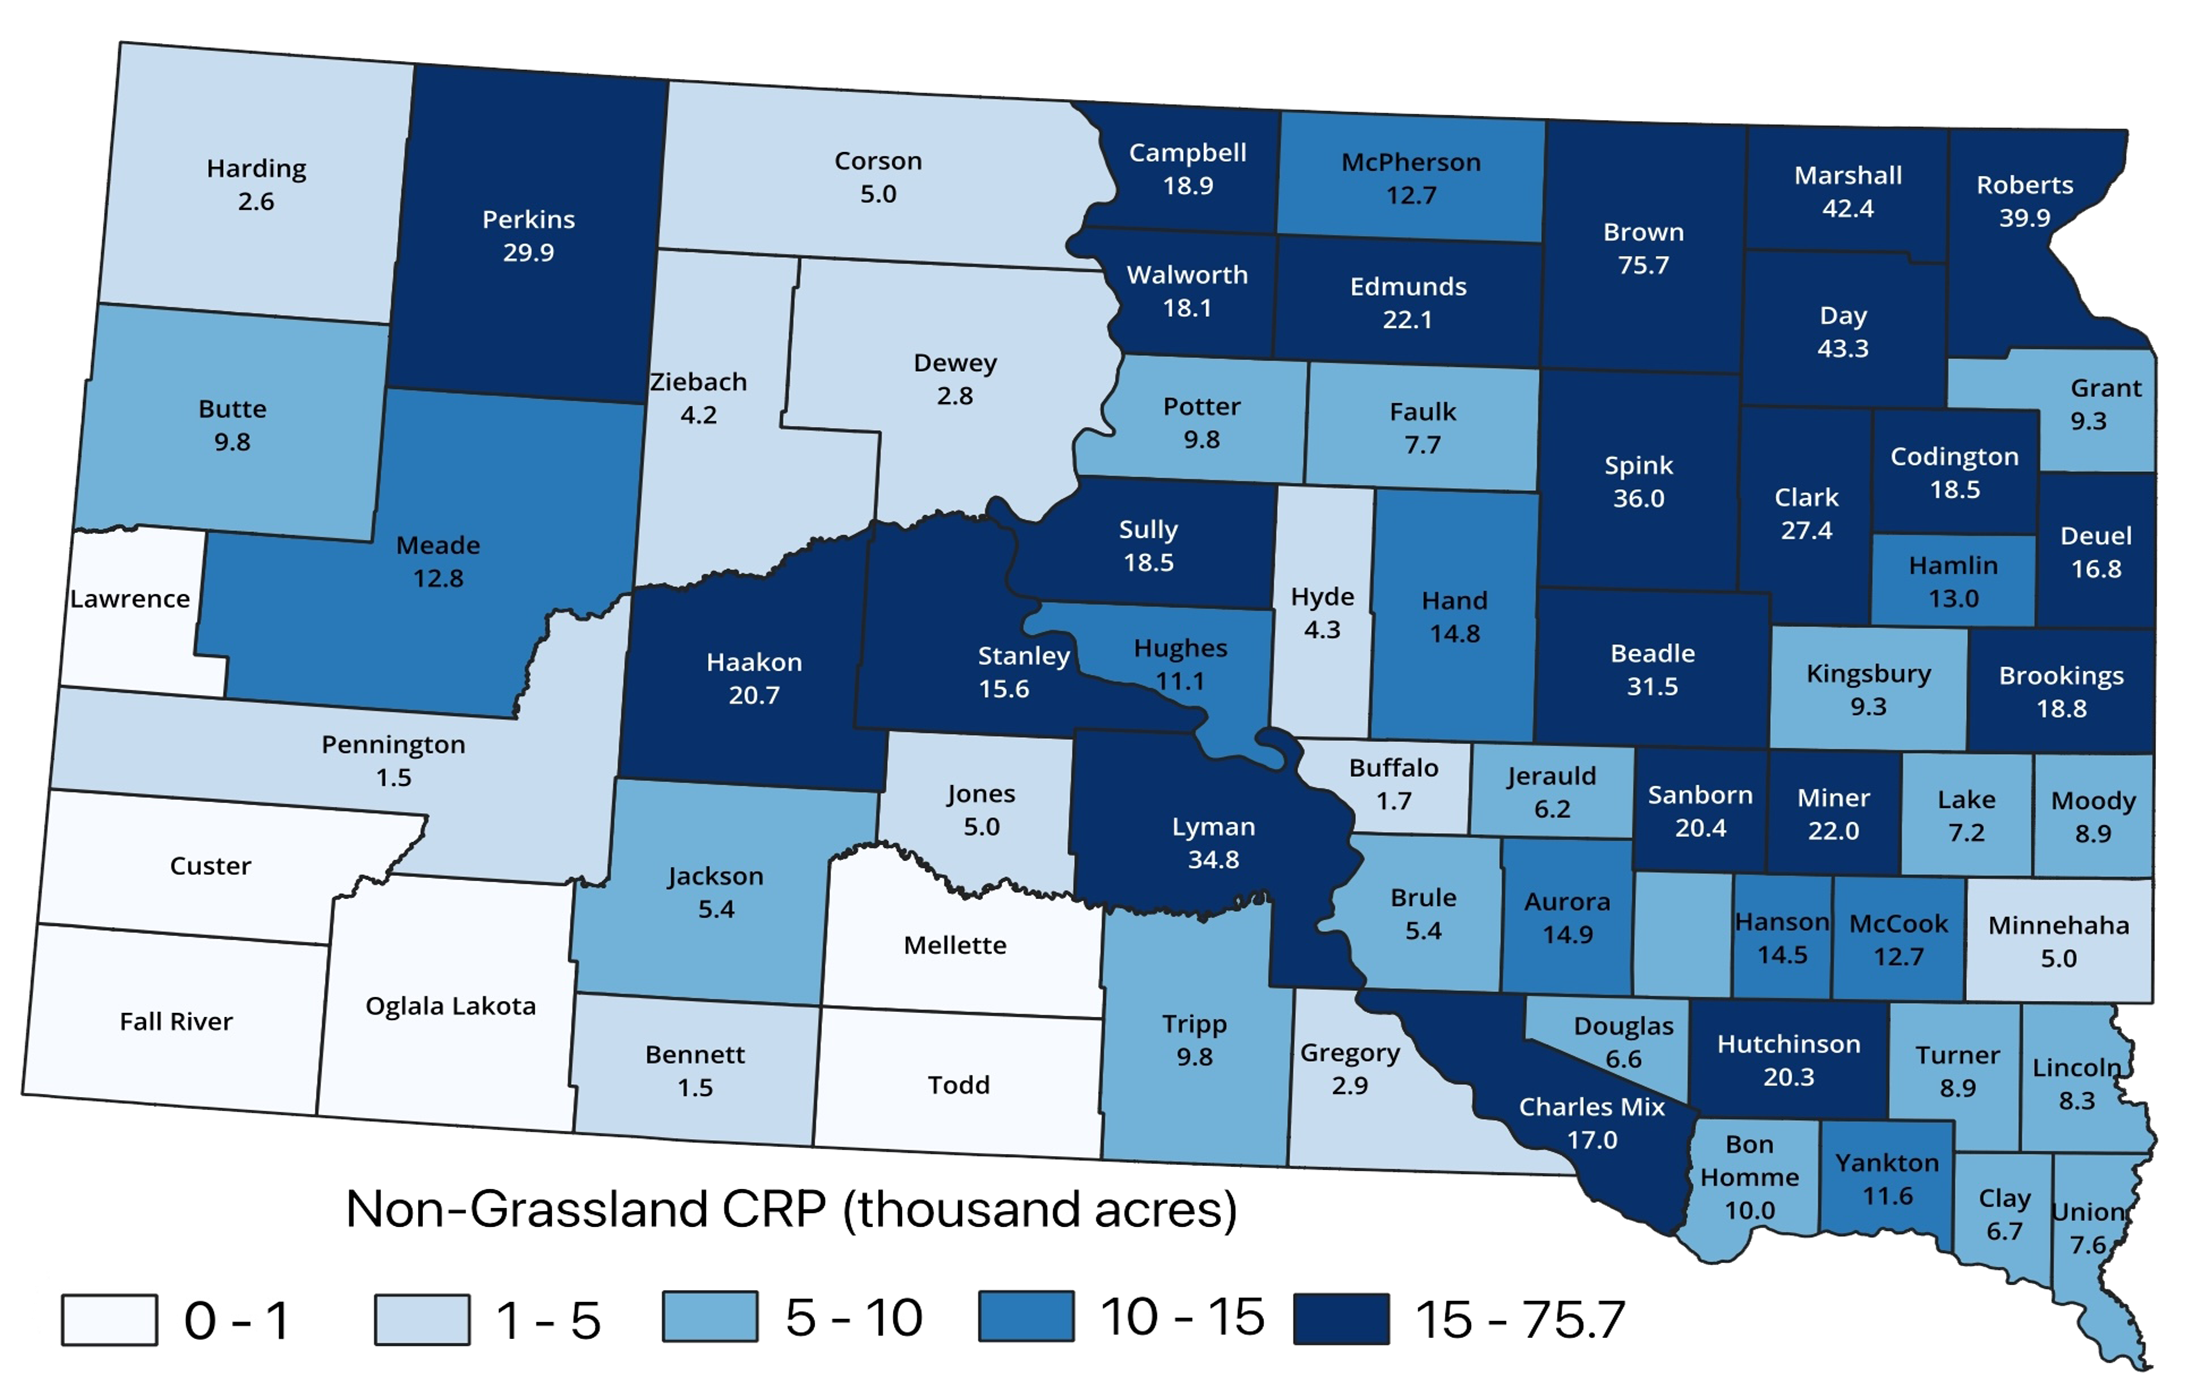
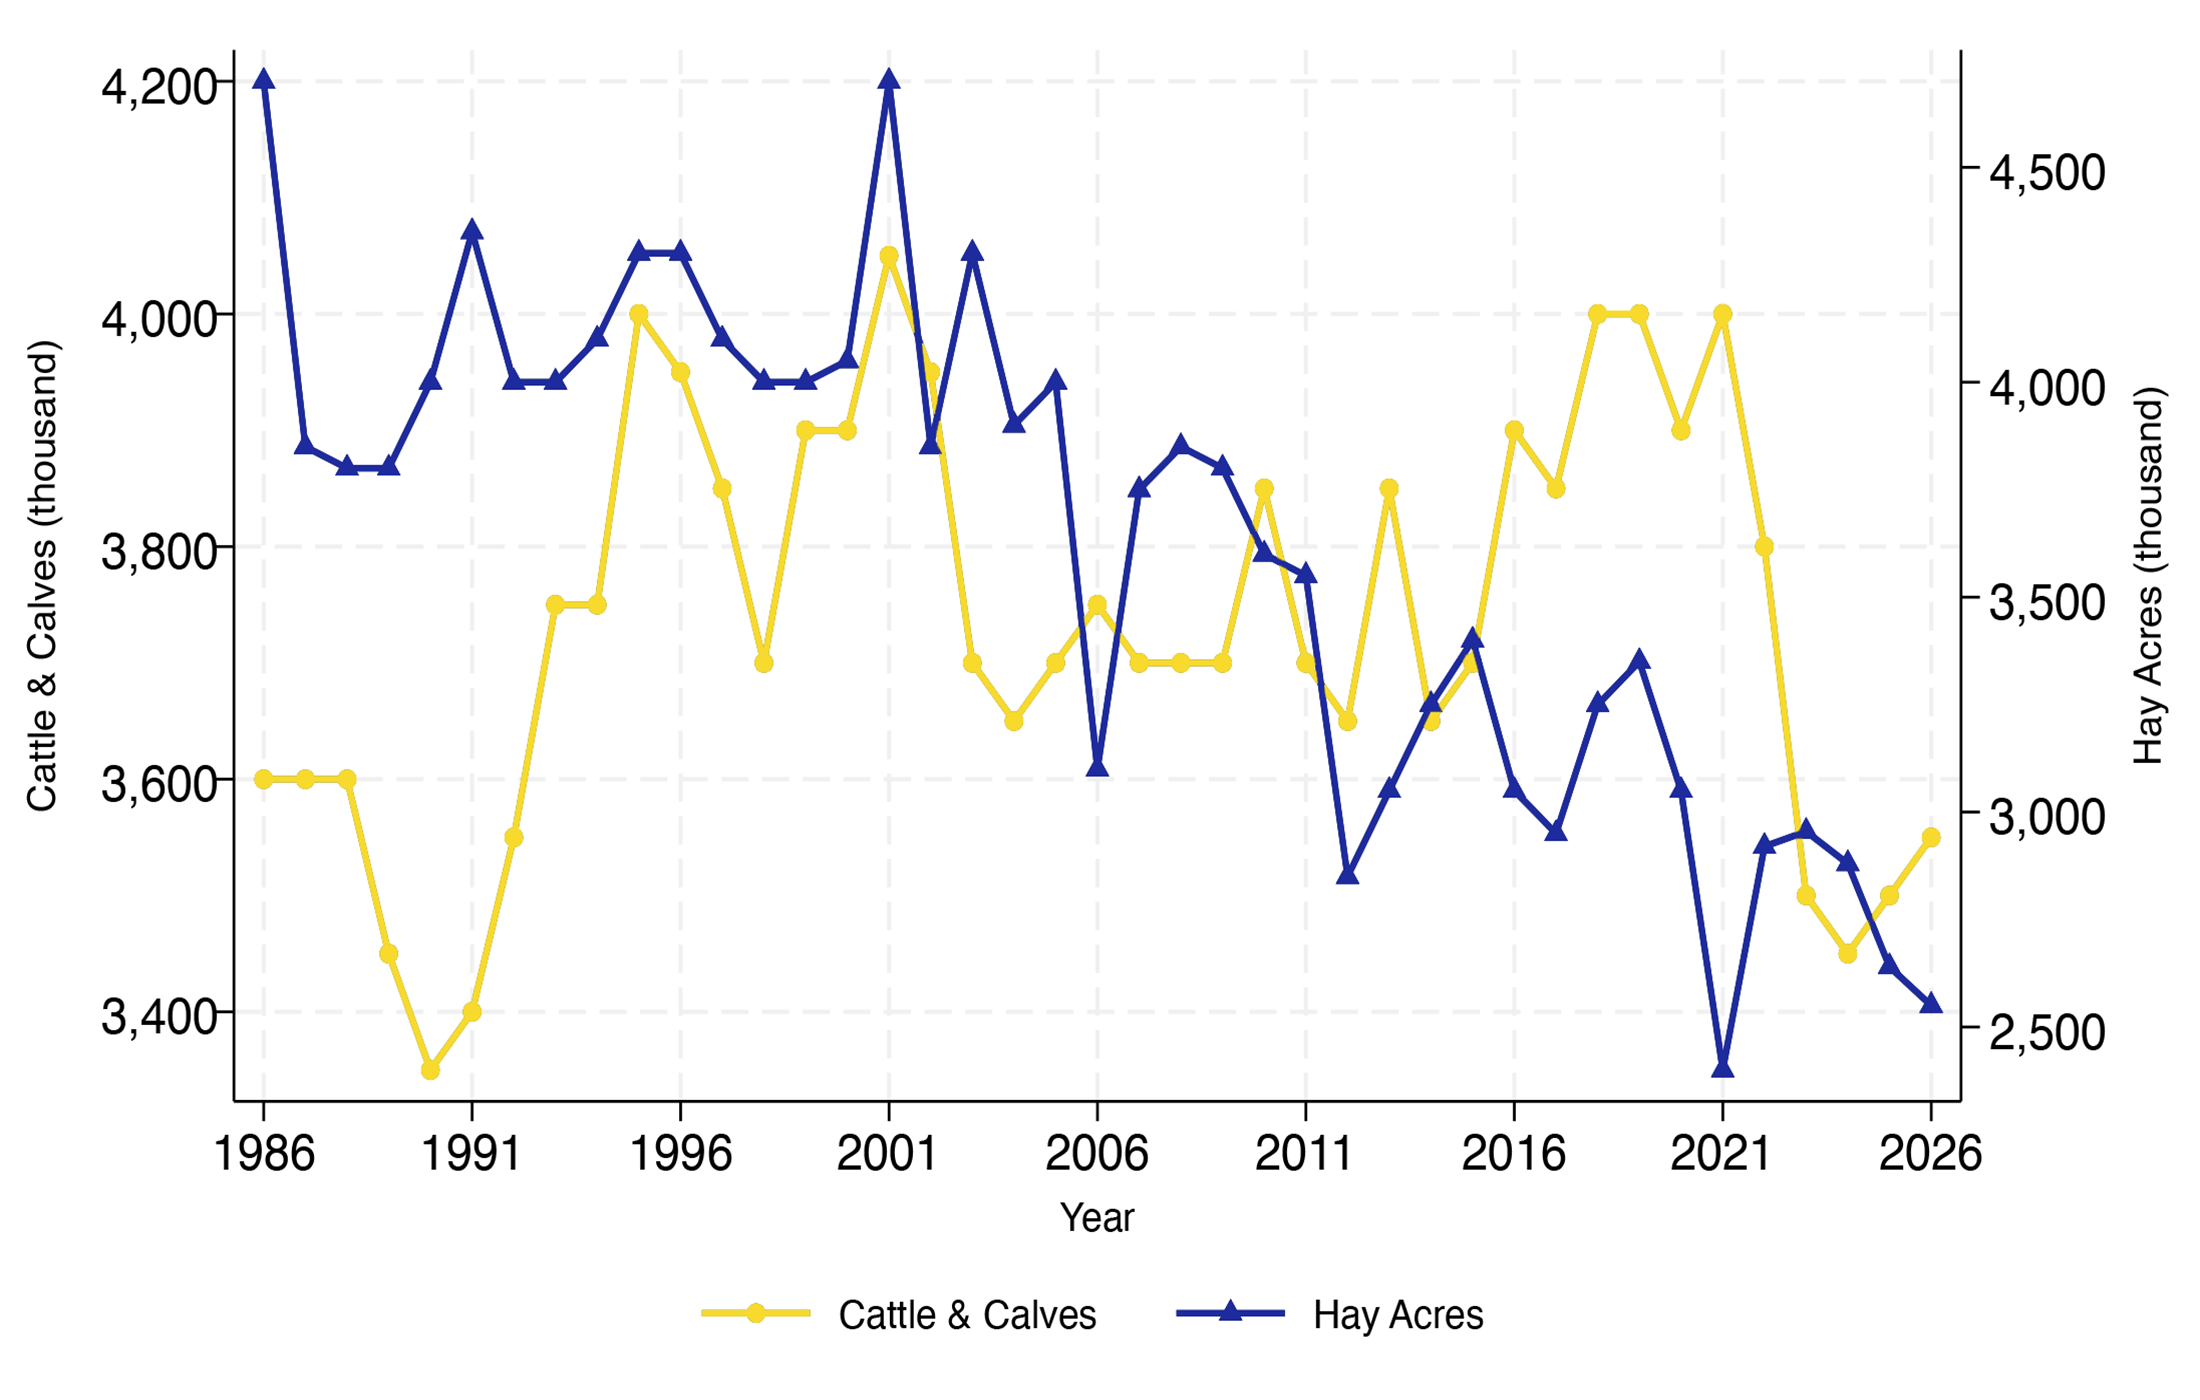
Figure 7 shows South Dakota’s total cattle and calves inventory (left axis, thousand head) and total harvested hay acres (right axis, thousand acres) from 1986 to 2026. Both series exhibit cyclical fluctuations consistent with cattle market cycles; however, harvested hay acres reflects a long-term declining trend, while the trend in total cattle and calves is less clear, except for a sharp decline after 2021.
A Grazing Situation Example
Forage production from pasture and grazing land is generally not estimated in any aggregate way. Acres are estimated in the Census of Agriculture, but the amount grazed would be privately-held information. For many states, including South Dakota, there is some related information collected by NASS that can be used to infer the supply of and demand for grazing.
Some prices for grazing can be used to determine the aggregate supply of forage if the market is in equilibrium. NASS has national, state, and county level pastureland rental rates, in $/acre, available annually. Through Quick Stats, cash rent for pastureland is released at the end of July for the current year at the national and state level. County estimates are released in late August. Thus, in July 2025 the estimates were released for calendar year 2025; for the U.S., pasture rent was $15.50 per acre and in South Dakota it was $31.00 per acre. There is substantial variability in pasture rents at the county level (USDA NASS). In January, NASS releases grazing fee rates for the prior year for 17 states located in the western half of the continental U.S. The rates are generally for animal unit, cow-calf and per head. A visual is available from USDA NASS.
An insufficient number of reports is a common occurrence. The animal unit rate for the 17-state region was $23.70 per month for 2025. The rate for South Dakota was $36.50 per month for 2025. More granular insights are available for South Dakota in South Dakota Agricultural Land Market Trends, 1991-2025 (Le 2025).
In a competitive market with full information the average pasture rental rate would be equivalent to the grazing fee rate. The quantity and value of pasture should be reflected in both measures. In equilibrium for South Dakota for 2025, the $31.00 per acre pasture rent would reflect the same production as the $36.50 per animal unit month (AUM) rate. Thus, each acre would reflect 0.85 AUM and each AUM would reflect 1.18 acres. Statewide in South Dakota, the Census estimate was for 23.0 million acres of pastures and grazing land. Thus, the aggregate supply of forage, as grazed, would be 19.55 million AUMs.
The length of the grazing season is implicitly reflected in the per-acre rent. Assuming a 5-month grazing season, the as-grazed AUM cost would be $182.50 ($36.50 × 5 months), which is equivalent to approximately 5.9 acres per animal unit (AU) for the year ($182.50 ÷ $31.00 per acre). If an additional 1.0 million acres were made available for grazing—for example, from annual forages—this would support approximately 169,491 animal units (AUMs) across South Dakota.
Full information would account for general variability in water, fencing, monitoring, and normal production variability. The equivalence would not account for losses to wildlife or extreme production changes. The per-acre rent implies such costs are incurred by the renter. With the AUM fee, such costs are incurred by the landowner. Thus, it would require more acres to produce the same viable AUMs to reflect wildlife losses and any production risk premium. For example, if wildlife consumption were high, it may require 1.24 acres per AUM, reducing the usable domesticated supply to 18.55 million AUMs.
The aggregate demand for grazing would come from livestock, predominantly cattle in South Dakota, but to a lesser extent sheep, bison, and horses. As of January 1, 2026, NASS estimated that South Dakota producers had 1.45 million beef cow-calf pairs, 800,000 heifers, and 810,000 steers and bulls. Assuming each pair reflects 1.2 AU and the other animals 1.0 AU gives 3.35 million AUs. With a 5-month grazing period, that would be aggregate demand of 16.75 million AUMs. An additional 1.0 million acres of grazable area would thus support 141,242 cow-calf pairs.
Forage Production Potential From Non-Grassland CRP Enrollment
With emerging drought conditions in many cattle production regions the prospect of using existing non-grassland CRP acres for emergency forage has been raised. Figure 8 has estimated state-level forage production potential on non-grassland CRP acres in thousand tons, calculated by multiplying each state’s 10-year average other hay yield (2015–2025) by its non-grassland CRP-enrolled acres in 2025. The geographic pattern closely reflects the non-grassland CRP enrollment map, as higher non-grassland CRP acreage is associated with higher potential forage production. Iowa leads all states with approximately 3.9 million tons, followed by Texas (3.3 million tons), Kansas (approximately 2.6 million tons), Washington (around 2.5 million tons), and Colorado (above 2.1 million tons). In contrast, Northeastern and Southeastern states with minimal non-grassland CRP enrollment — such as Nevada, Arizona, and most New England states — show negligible hay production potential. This suggests that if CRP acres were converted to hay production, the supply would be heavily concentrated in the Great Plains and Midwest, the same regions that already dominate U.S. hay and forage markets. Using state-level averages likely misstates the forage potential. However, county-level hay yields have not been collected by NASS since 2018.

Several trends are evident related to forage production at the national and local level. While CRP acres have increased in recent years, the growth in enrolled acres has occurred mainly among grassland CRP acres, which were and are being grazed. The trend has been for fewer non-grassland acres, which have returned to cropland and mainly of annual row crops. The decline in harvested hay acres reflects this trend. Fewer hay acres correspond to lower cattle inventory levels. However, causality is difficult to attribute as cattle consume annual forages too.
References
- Fuller, Kate Binzen, Daniel Hellerstein, Andrew Rosenberg, Dipak Subedi, Catherine Feather, Rich Iovanna, Bryan Pratt, and Roger Claassen. 2026. Status and Trends of USDA Conservation Programs, 2002–2025. Report No.EB-49. U.S. Department of Agriculture, Economic Research Service.
- Le, Hoanh. 2025. South Dakota Agricultural Land Market Trends, 1991-2025: Results from the 2025 SDSU Extension South Dakota Farm Real Estate Survey. South Dakota State University, Ness School of Management and Economics.
- Rosenberg, Andrew B, Bryan Pratt, David Arnold, and Ryan Williams. 2024. Land use of rejected, enrolled, and expiring fields in the conservation reserve program. Report No. EIB-276. U.S. Department of Agriculture, Economic Research Service. U.S. Department of Agriculture, Farm Service.