South Dakota Soybeans Production and Yield in 2024 and 2025
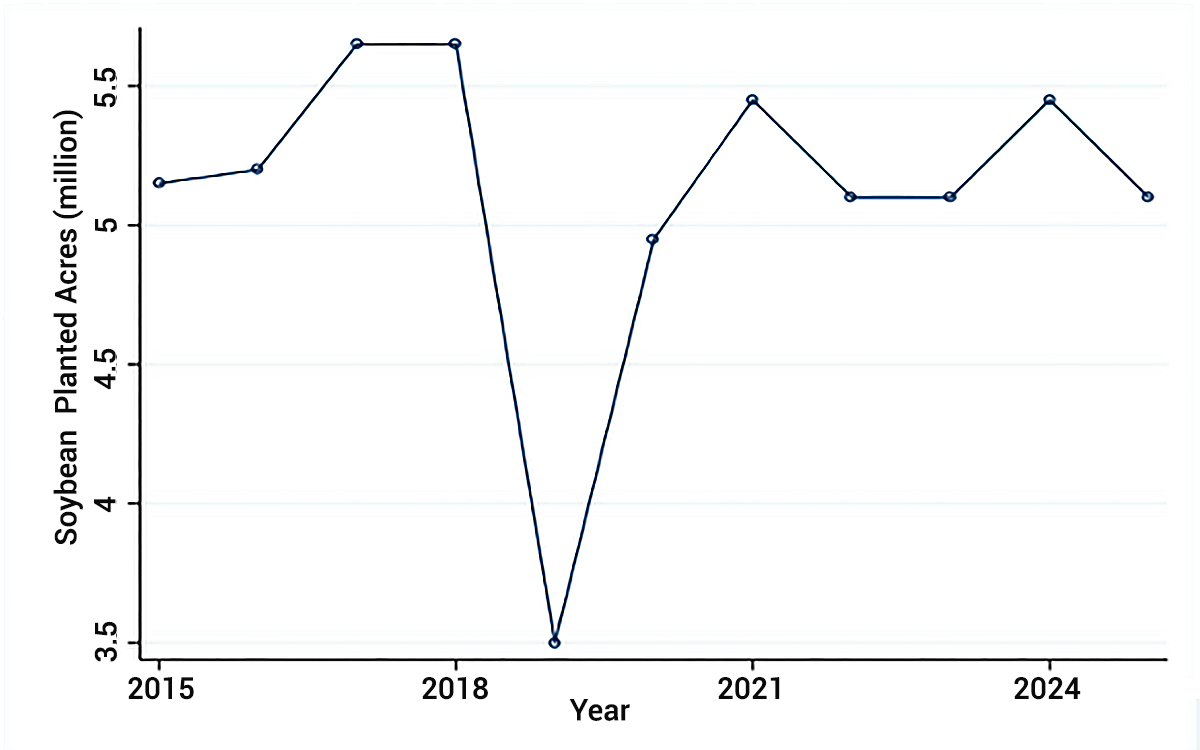
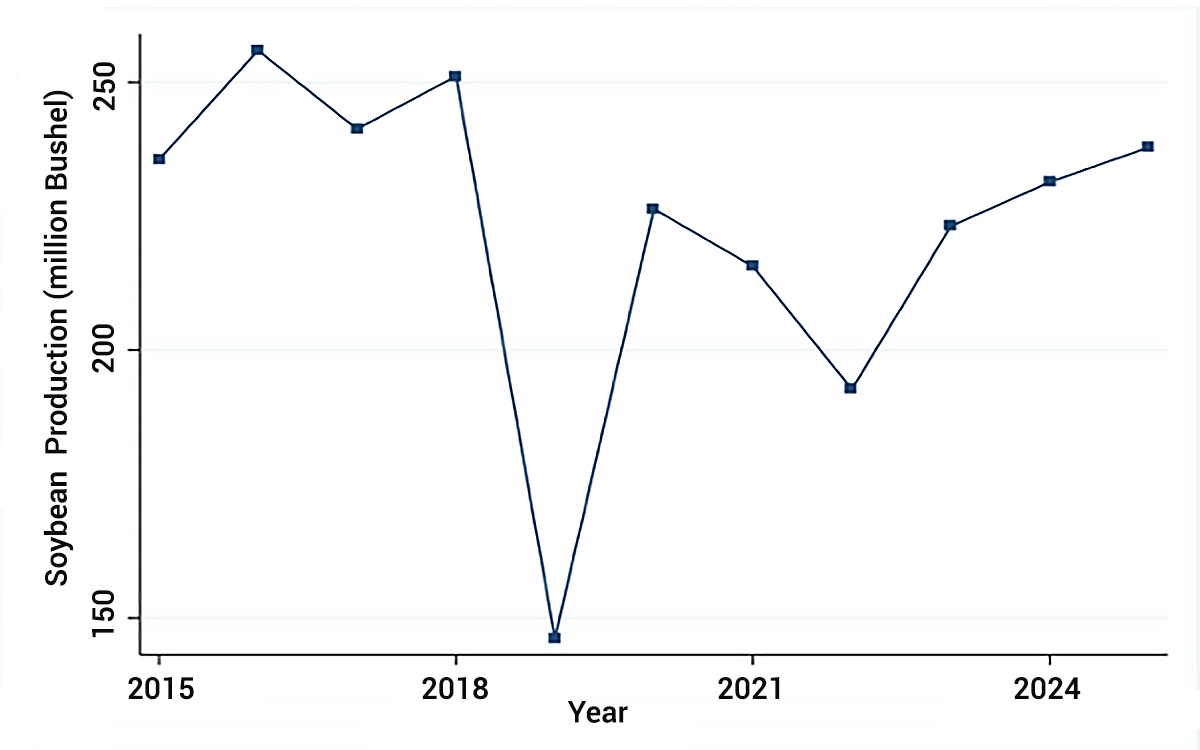
Soybeans were the second largest crop in South Dakota in 2024, accounting for approximately 35 percent of the state’s total crop cash receipts. According to the USDA National Agricultural Statistics Service (NASS), the state planted 5.45 million acres of soybeans in 2024, producing about 231 million bushels. In 2025, soybean planted acreage declined to 5.1 million acres; however, total production increased to approximately 238 million bushels due to higher yields compared with 2024.
Figures 1-A and 1-B illustrate the trends in soybean planted acreage and total soybean production in South Dakota over the past decade. In 2019, South Dakota’s soybean planted acres were approximately 3.55 million, the lowest level during this period. Excessive rainfall and flooding in early spring 2019 delayed planting and resulted in the highest prevented-plant acres that year, significantly reducing soybean planting acres. In addition, the U.S.-China trade conflict reduced export demand, driving down soybean prices and making it less attractive for farmers to plant soybeans that year. Over the past five years, soybean planted acreage in South Dakota has generally stabilized, ranging between 5.1 and 5.45 million acres.
2024 Soybeans Yield by County
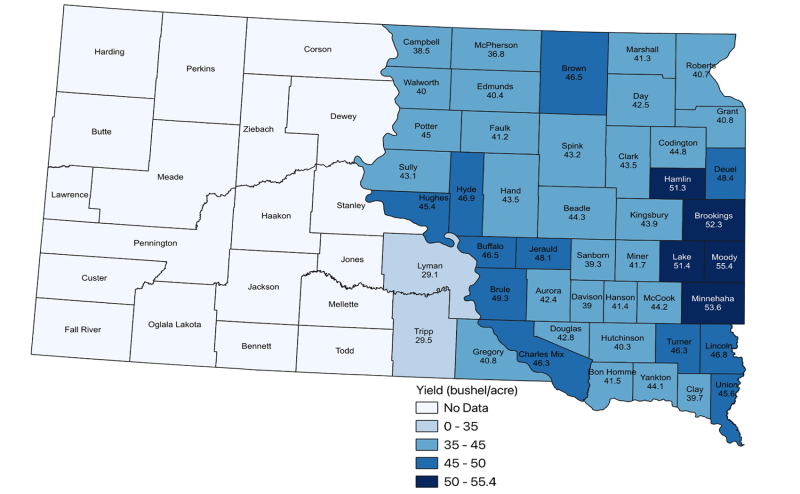
The statewide average yield is 47 bushels per acre in 2025, up 9.3 percent from 43 bushels per acre in 2024. However, average yields vary substantially across counties due to differences in soil quality, weather patterns, and management practices. Because county-level 2025 yield data have not yet been released, we will examine 2024 soybean yields at the county level. Figure 2 presents the average yield for non-irrigated cropland using data from the USDA Risk Management Agency (RMA). Unlike survey-based yields from the National Agricultural Statistics Service (NASS), which do not report yields for many South Dakota counties due to small sample sizes or low response rates in those counties, county yields from RMA are based on an aggregate of individual yields from participants in crop insurance programs within a county. Li et al. (2020) find that county yields from RMA are slightly higher than NASS estimates, but they are not statistically significantly different most of the time. In 2024, Moody had the highest yield in South Dakota at 55.4 bushels per acre, while Lyman and Tripp had the lowest, averaging just 29 bushels per acre.
10-Year Average Yield (2015-2024) by County

Crop yields can vary significantly from year to year due to unpredictable factors such as drought, floods, pest infestations, disease outbreaks, and soil conditions. Relying on data from just one year might give a skewed picture; for instance, an unusually wet or dry year could inflate or depress yields, leading to misleading conclusions about a county’s productivity. By contrast, averaging yields over multiple years smooths out these anomalies, providing a more reliable baseline that reflects the county’s productivity. Figure 3 presents the average soybean yield by county over the past ten years. Counties with higher soybean yields are mainly located in the eastern part of South Dakota, while yields generally decline moving toward the western part of the state. Moody County records the highest 10-year average yield at 56.8 bushels per acre, whereas Lyman County has the lowest at 32.5 bushels per acre. In 2024, yields exceeded the 10-year averages in counties near the Missouri River but were lower in counties along the borders with Iowa and Minnesota, as illustrated in Figures 2 and 3.
In Summary
In summary, South Dakota’s soybean production has experienced fluctuations in both planted acres and total production over the past decade. Although the statewide average yield in 2025 is higher than in 2024, and the 2024 average is about the same as the 10-year average, soybean yields vary significantly across counties. Eastern regions consistently demonstrate higher productivity, while western areas tend to have much lower yields. For more detailed county-level yield data by year, based on NASS and RMA sources, visit the South Dakota Ag Land Income Tracker.
References
Li, X., Shen, Z., Harri, A., & Coble, K. H. (2020). Comparing survey-based and programme-based yield data: implications for the US Agricultural Risk Coverage-County programme. The Geneva Papers on Risk and Insurance-Issues and Practice, 45(1), 184-202.


