Developed by Matthew Elliott, SDSU Extension Agribusiness Specialist.
The SDSU Basis Report application provides an interactive platform for monitoring basis values—representing the difference between the cash price paid for grain locally and the nearby futures price. Variations in basis can be attributed to local supply and demand shifts or alterations in transportation costs impacting delivery to distant end-users. For example, a narrowing basis often signals increased local demand, reduced supply, or decreasing transportation expenses. Conversely, a widening basis may reflect diminished demand, augmented supply, or elevated transportation costs.
Interactive Tools Within the App
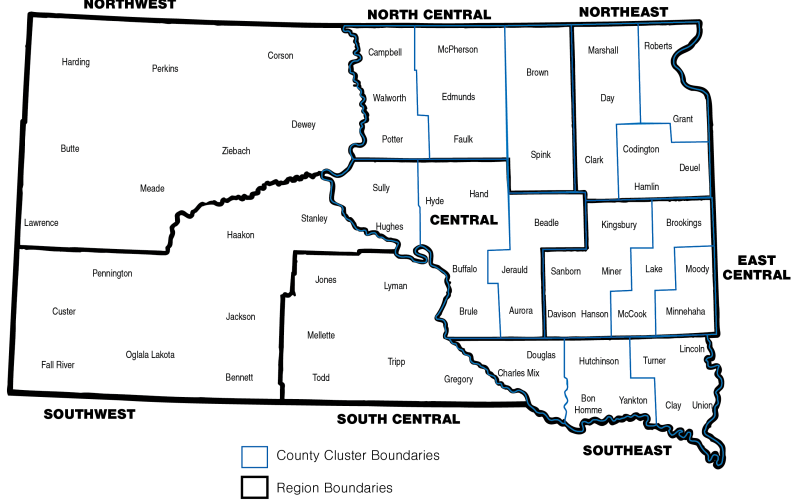
Corn and Soybean Basis Charts: Discover historical trends for corn and soybean basis across South Dakota crop reporting districts. These charts, accessible through the "Corn Basis Chart" and "Soybean Basis Chart" tabs, allow users to explore basis values over time, supported by dynamic dropdown menus to filter by district. This feature helps farmers and market observers to make informed decisions. Users can also download csv files of the data in the app.
Corn and Soybean Maps: Through the "Corn Map" and "Soybean Map" tabs, users can investigate interactive maps illustrating basis variations county-wise. These maps are dynamically updated according to the latest available data, providing users with insights into geographic basis fluctuations in the state. Users can further filter these maps based on the most recent years and months.
The SDSU Basis Report continues to evolve, consistently updating basis figures and enhancing functionalities to better serve South Dakota farmers and agricultural stakeholders in managing basis risk and understanding the broader market landscape.


