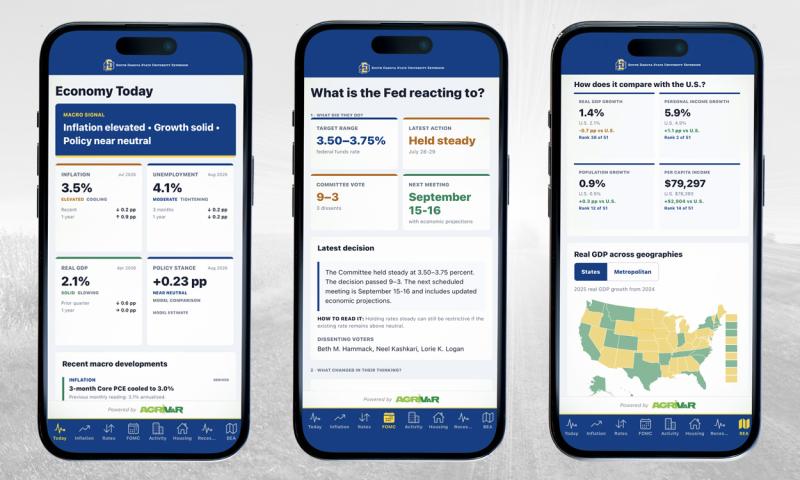
Developed by Matthew Elliott, Associate Professor & SDSU Extension Agribusiness Specialist.
The Macroeconomic Report mobile app brings current economic data and practical interpretation together in one place. It is designed for agricultural producers, businesses, lenders, students, policymakers, and anyone who wants to understand how inflation, employment, economic growth, housing, financial markets, and Federal Reserve policy are changing.
The app is available for free on the Apple App Store and Google Play.
Instead of presenting statistics as isolated releases, the app connects related indicators and explains what they may mean for households, businesses, financial markets, and agriculture. It also distinguishes published observations from calculated values, market-derived measures, model estimates, and app-created interpretations.
One App, Several Views of the Economy
Macroeconomic conditions influence borrowing costs, consumer demand, business investment, commodity prices, land values, employment, and government revenue. For agricultural producers and agribusinesses, they can affect operating loans, machinery purchases, farmland financing, export demand, input costs, and risk-management decisions.
No single statistic provides a complete picture. Inflation may cool while interest rates remain restrictive, or output may remain above its year-earlier level while growth loses momentum. The app helps users interpret these combinations by organizing its reports into five primary areas: Today, Economy, Markets, Fed, and Regions.
Today provides the national overview. Economy opens detailed reports on inflation, labor, activity, housing, and the business cycle. Markets brings together interest rates, credit conditions, and federal financing. Fed focuses on FOMC decisions and expectations, while Regions supports state and national comparisons.
Economy Today
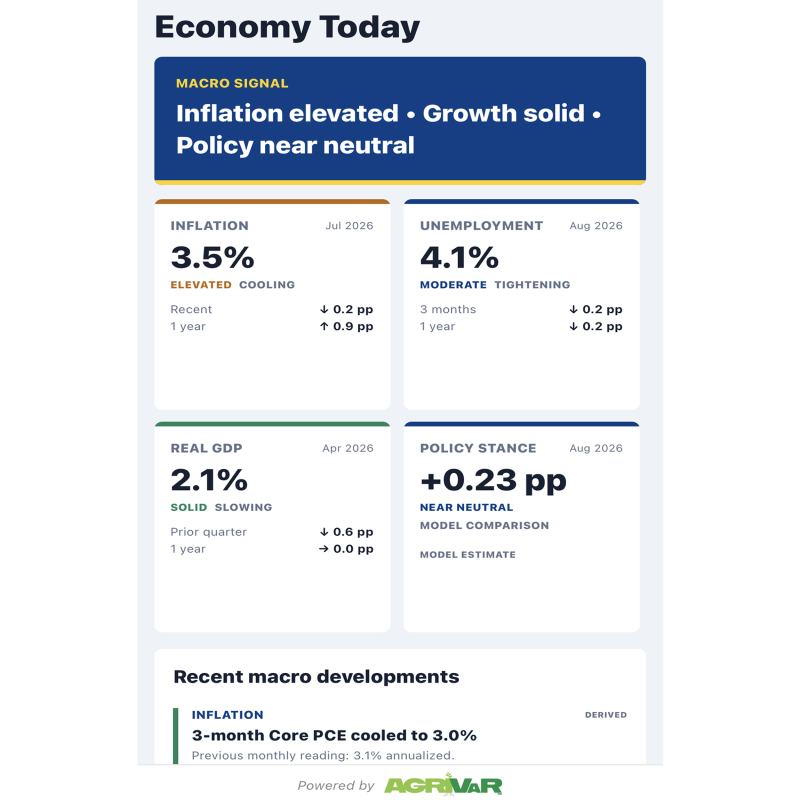
The Economy Today screen provides a concise starting point. Four signal cards summarize:
- Inflation
- Labor-market conditions
- Economic growth
- Monetary-policy stance
Below the headline view, recent developments show how inflation momentum, payroll growth, Treasury yields, and Federal Reserve communication have changed. A policy framework compares inflation with the Federal Reserve's longer-run 2% PCE inflation objective and output with estimated economic potential.
The screen also compares the expected real federal funds rate with an estimate of the neutral real interest rate. This gives users a consistent framework for considering whether monetary policy appears restrictive, accommodative, or near neutral.
Because the neutral rate cannot be observed directly, the comparison is clearly identified as model-based.
Inflation
The Inflation screen separates the consumer inflation experience from the inflation measure emphasized by the Federal Reserve.
Consumer Price Index data show average changes in prices paid by urban consumers for a representative basket of goods and services. Personal Consumption Expenditures data provide the Federal Reserve's primary inflation benchmark.
The screen includes:
- Headline and core CPI inflation
- Headline and core PCE inflation
- Three-, six-, and twelve-month Core PCE momentum
- Inflation by category, including food, energy, shelter, goods, and services
- Market and model measures of expected inflation
- Evidence supporting or challenging continued disinflation
Shorter inflation horizons can identify turning points more quickly, while the 12-month inflation rate provides a smoother view of the longer-term trend. The app explains that sustained cooling across shelter and services provides stronger evidence of broad-based disinflation than a temporary decline driven mainly by volatile energy prices.
Real Economic Activity
The Real Economy screen examines whether economic activity is strengthening, slowing, or contracting. It combines quarterly GDP with more frequently updated measures of household demand, income, production, and employment.
Indicators include:
- Real gross domestic product
- Real consumer spending
- Real disposable personal income
- Industrial production
- Nonfarm payroll employment
- Initial unemployment claims
The screen emphasizes the breadth of economic change. Weakness in a single indicator may reflect normal volatility or sector-specific conditions, whereas deterioration across spending, income, production, and employment provides more meaningful evidence of a broad slowdown.
Supporting monetary indicators show M2 money balances and M2 velocity. These measures describe the monetary backdrop for nominal economic activity, but the app explains why neither measure alone indicates inflationary pressures or recession risk.
Labor Market
The Labor Market screen follows job creation, unemployment, labor demand, layoffs, labor supply, and wage pressure. It combines payroll growth and the unemployment rate with measures such as job openings, unemployment claims, participation, and earnings growth.
The report helps users distinguish a gradual return to balance from a sharper deterioration in employment conditions. Wage growth is presented as one part of the inflation picture rather than as a one-for-one cause of inflation because productivity, labor composition, demand, and business margins all affect how wages flow through to prices.
Recession Watch
The Recession Watch screen combines current economic indicators with the official business-cycle chronology maintained by the National Bureau of Economic Research.
The NBER dates recessions retrospectively and evaluates the depth, diffusion, and duration of declines in economic activity. Therefore, the app does not present the latest NBER-dated phase as a real-time recession declaration. Instead, it uses current indicators to assess whether economic weakness is becoming broad and significant.
The historical chart overlays the U.S. unemployment rate on shaded NBER recession periods. This helps users see how unemployment behaved during previous business cycles, including how it often continued to rise after a recession began and sometimes peaked near or after its end.
Federal Reserve Policy
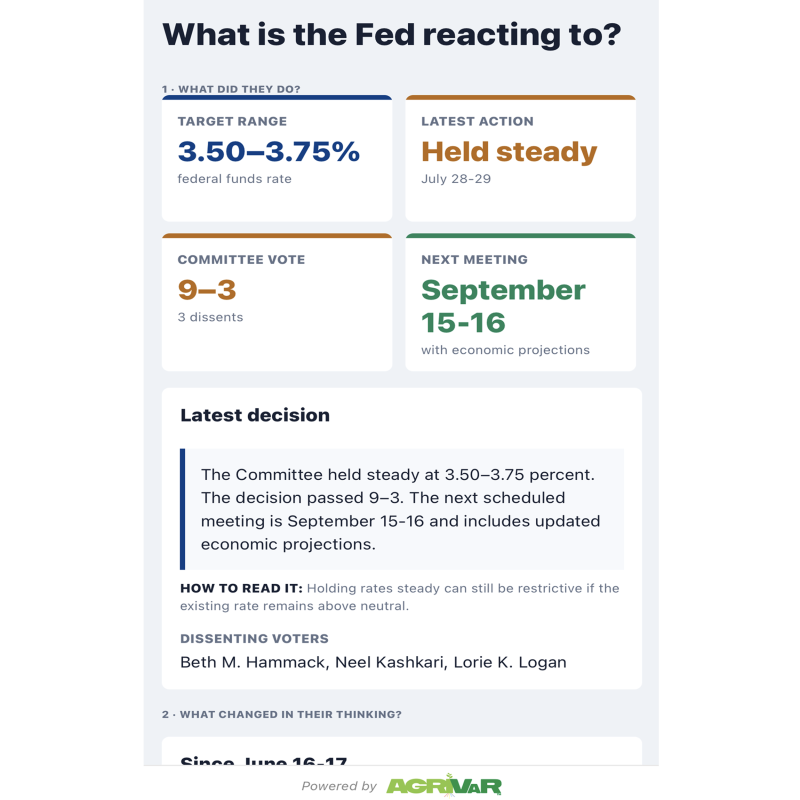
The Federal Reserve screen explains what the Federal Open Market Committee did, what changed in its communication, and which economic conditions may be influencing policy.
Features include:
- The current federal funds target range
- The latest policy decision and vote
- Dissenting voters
- The next scheduled FOMC meeting
- Comparisons between current and previous FOMC statements
- Inflation, employment, and economic-activity signals
- Summary of Economic Projections
- Market-implied federal funds rate paths
- Links to official statements, minutes, projections, and press conferences
The app clearly separates Federal Reserve projections from market expectations. The Summary of Economic Projections represents participants' assessments of appropriate monetary policy under their individual economic outlooks. Federal Funds futures represent market-implied future effective rates and are not policy commitments or guaranteed forecasts.
Any thresholds used to summarize policy pressure are labeled as app-created heuristics rather than Federal Reserve decision rules.
Interest Rates and Neutral Policy
The Rates and Neutral screen helps users understand the Treasury yield curve, interest-rate expectations, and the estimated stance of monetary policy.
The screen includes:
- Treasury yields from three months through thirty years
- Current yields compared with approximately one month earlier
- The 10-year minus 2-year Treasury spread
- The 10-year minus 3-month Treasury spread
- Changes in nominal Treasury yields
- Changes in real Treasury yields
- Changes in inflation compensation
- Federal Funds futures
- The expected real policy rate
- The Holston-Laubach-Williams neutral-rate estimate
- Taylor-rule policy benchmarks
The app explains that the yield curve reflects several forces, including expectations for future short-term rates, inflation compensation, real interest rates, and term premiums. It also identifies the uncertainty surrounding neutral-rate estimates and presents policy rules as analytical cross-checks rather than forecasts or recommendations.
Financial Conditions
The Financial Conditions report examines how monetary policy and market developments are transmitted through asset prices, credit markets, banks, and borrowing costs. It distinguishes the price of finance from the availability and use of credit.
The report includes:
- The Chicago Fed National Financial Conditions Index and Adjusted National Financial Conditions Index
- Investment-grade and high-yield corporate bond spreads
- Bank lending standards and loan demand from the Senior Loan Officer Opinion Survey
- Commercial and industrial loan growth
- Mortgage rates and the assessed stance of monetary policy
- Separate evidence for easier and tighter conditions
The app reads these measures together rather than treating any single index as a complete verdict. For example, narrow bond spreads can coexist with restrictive bank standards, and weak loan growth may reflect reduced borrower demand, tighter credit supply, repayment, or a combination of those forces. The resulting transmission assessment is explicitly qualitative, not a numerical estimate of the Federal Reserve's effect on financial conditions.
Treasury and Fiscal Conditions
The Treasury & Fiscal report connects federal borrowing needs with announced Treasury security supply, interest expense, long-term rates, and debt-management operations.
Features include:
- The federal deficit as a share of GDP
- Debt held by the public in dollars and as a share of GDP
- Federal interest payments
- The latest announced Treasury bill, note, and bond offerings
- Nominal and real 10-year Treasury yields
- Ten-year inflation compensation
- A model-estimated 10-year Treasury term premium
- Completed and scheduled Treasury buybacks
The report avoids treating federal borrowing as a mechanical explanation for long-term interest rates. Treasury yields also reflect expected short-term rates, inflation compensation, growth expectations, duration risk, investor demand, liquidity, and global risk appetite. Likewise, the term premium is identified as a model estimate rather than a directly observed measure of fiscal risk.
Treasury buybacks are presented as debt-management operations, not Federal Reserve quantitative easing. Auction amounts are labeled as announced gross offerings rather than net borrowing or total quarterly issuance.
Housing and Affordability
The Housing screen shows how interest rates are transmitted to housing markets. It combines financing costs with construction, sales, inventory, home-price, and affordability measures.
Features include:
- The 30-year mortgage rate
- Housing starts
- Building permits
- New single-family home sales
- New-home months' supply
- A representative mortgage-payment comparison
- Quarterly and annual home-price changes
- State and national FHFA house-price histories
- Rankings for all 50 states and Washington, D.C.
The report treats home-price appreciation as direction-neutral. Rising prices may reflect strong demand or limited supply, but they can also reduce affordability. Declining prices may improve affordability for some buyers while weakening household wealth or collateral values for existing owners.
State and Regional Economy

The Regional screen allows users to examine economic conditions for individual states and the United States.
Users can compare:
- Real GDP growth
- Personal income growth
- Population growth
- Per capita income
- Home-price growth
- State rankings
- State values with national benchmarks
- Industry concentration relative to the U.S.
The screen provides both annual and quarterly GDP views. Annual sector data represent full-calendar-year current-dollar GDP. Quarterly GDP levels are seasonally adjusted annual rates and should not be interpreted as output accumulated during the year.
Quarterly features include:
- Current-dollar GDP
- Annualized quarter-over-quarter real GDP growth
- Real GDP growth from the same quarter one year earlier
- Current-dollar GDP by industry
- Nominal quarterly industry growth
Industry concentration measures show whether a sector represents a larger or smaller share of a state's economy than it does nationally. This can help users understand which industry-specific developments may have an unusually large regional effect.
Release and Signal Alerts
On supported iPhones and iPads, users can choose which push notifications they receive. Available alerts cover CPI inflation, PCE inflation, employment, GDP, FOMC decisions, and material changes in the app's labor-market signal.
Release alerts are generated only when the required observations for a new release period are available. They link users to the relevant report in the app. Notification settings can be changed independently for each category and disabled in iOS settings.
Data Sources and Updates
The Macro Economic Report uses authoritative public data and official source material, including information from:
Selected market-derived measures use futures and corporate bond market data. The app identifies these measures separately from official observations and explains important limitations, including risk premiums, contract mechanics, and model uncertainty.
Data are refreshed according to the publication schedules of the underlying sources. Some indicators update daily or weekly, while others update monthly, quarterly, or annually. Federal Reserve statements and projections update after scheduled releases. NBER recession dates change only when the Business Cycle Dating Committee announces an official turning point.
The app retrieves updated observations automatically. Users can pull down on report screens to request the latest available data. Published values may later change when an agency revises seasonal adjustments, incorporates more complete source information, or issues benchmark revisions.
Because public data services can be temporarily unavailable, the app retries transient network and server failures and continues serving the most recently retrieved report while a refresh is retried. It does not silently present suspect market histories: Treasury futures charts are withheld when source-price validation detects an implausible same-contract discontinuity, while authoritative cash Treasury yield data remain available.
The date displayed in the app identifies when the report was refreshed. Observation periods shown beside individual measures identify when the underlying statistic was recorded.
Understanding the App's Interpretations
The app distinguishes among several types of information:
- Observed: Values published by an official statistical agency or institution.
- Derived: Calculations based on published observations, such as growth rates or yield spreads.
- Market-derived: Measures inferred from traded financial instruments.
- Model estimate: Values produced by an economic model, such as the neutral real interest rate.
- App interpretation: A structured summary created from multiple indicators.
App interpretations are intended to help users organize economic evidence. They are not official determinations by SDSU, the Federal Reserve, the NBER, or any other data provider. They should not be treated as investment, lending, marketing, or policy recommendations.
About the Tool
The project is designed to make authoritative economic information easier to access and interpret, particularly for South Dakota agricultural producers, agribusinesses, students, and community decision-makers.
The app will continue to evolve as new datasets become available, source agencies revise their publications, and users identify additional economic questions that would benefit from clearer mobile analysis.
Download the App
The Macro Economic Report is available for free on both Apple and Android devices. It can be downloaded for Apple devices at the App Store and is available on Android devices via Google Play. Use the buttons below to get started today.
Funding Acknowledgement
This work is supported by the Hatch Act, project award SD00H858-26, from the U.S. Department of Agriculture's National Institute of Food and Agriculture.
Project: Real-Time Monitoring & Management of Risk for Ag Producers and Agribusinesses
Institution: South Dakota State University, Ness School of Management and Economics
Accession No.: 7009837