Written with contributions by Bree A. Eastman, Montana State University; Alex B. Shupinski, South Dakota State University and University of Oulu; and Rachel A. Short, South Dakota State University.
Introduction
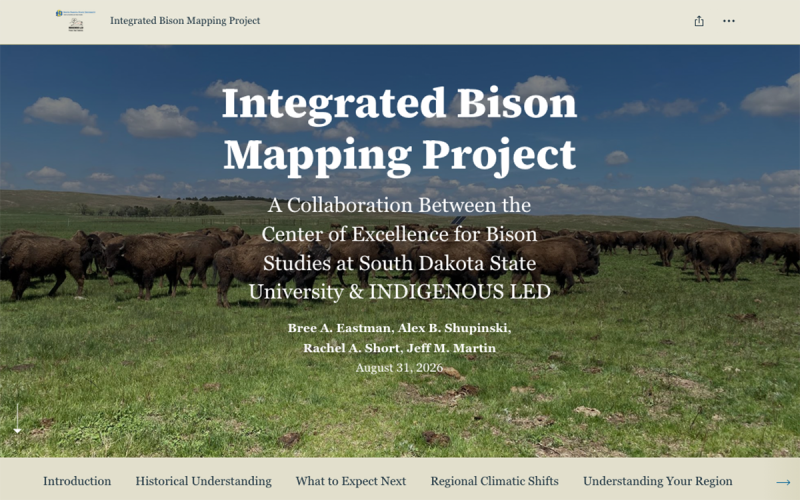
The Integrated Bison Mapping Project (IBMP) provides visual and interactive information about current and future climatic, environmental, and anthropogenic factors on the North American landscape. This project aims to support informed decision-making and long-term conservation planning for future stewardship of North American bison (Bison bison; hereafter referred to as bison). As climate conditions continue to change, proactive adaptative strategies will be increasingly more important for maintaining healthy and resilient bison herds. The interactive StoryMap serves as a centralized resource to support conservation planning by incorporating future climate projections, examining climatic variability across regions, and considering the potential impacts of these variables on bison management. The IBMP will help to bridge the gap between climate science and bison stewardship by making peer-reviewed scientific resources more accessible and engaging for stewards, managers, and conservation practitioners.
The IBMP is designed to support bison managers, Indigenous caretakers, conservation professionals, researchers, educators, students, and the public who are considering the future of bison populations in North America. The IBMP is intended to make future climate predictions more accessible to users who are interested in understanding how projected climatic and environmental changes may influence bison management strategies and conservation planning.
Using the IBMP StoryMap: Step-by-Step Guide
Accessing the IBMP StoryMap
- Launch the StoryMap
- Once the StoryMap has loaded, you should be able to do most of the reading by scrolling.
- Different pages will load as you explore the interactive content and maps.
- As you progress through the StoryMap, interact with the various features to learn about historical, current, and projected bison distributions, climate suitability, and regional conservation information.
Viewing Options
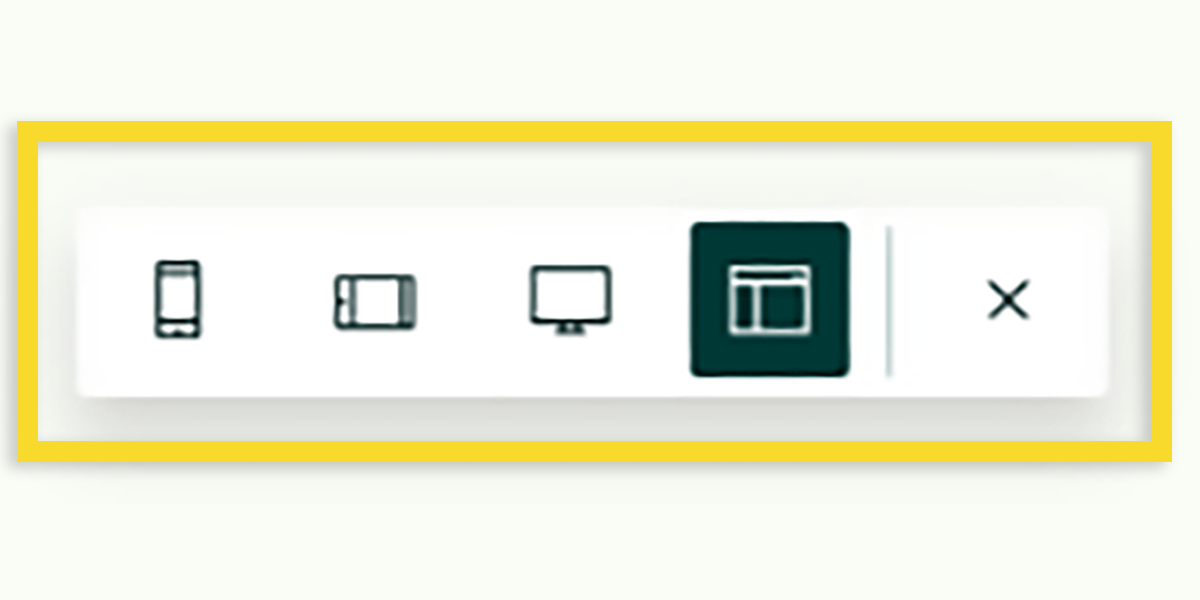
The ArcGIS StoryMap is designed to be compatible for viewing on a wide variety of devices, including smartphones, tablets, laptop computers, and larger computer monitors.
To select a preferred viewing size, viewers can select one of the four viewing options displayed in the toolbar that appears on the bottom right-hand corner of the StoryMap.
Please note that the view options toolbar may not always appear on all devices, particularly devices with larger screens.
Navigation Bar
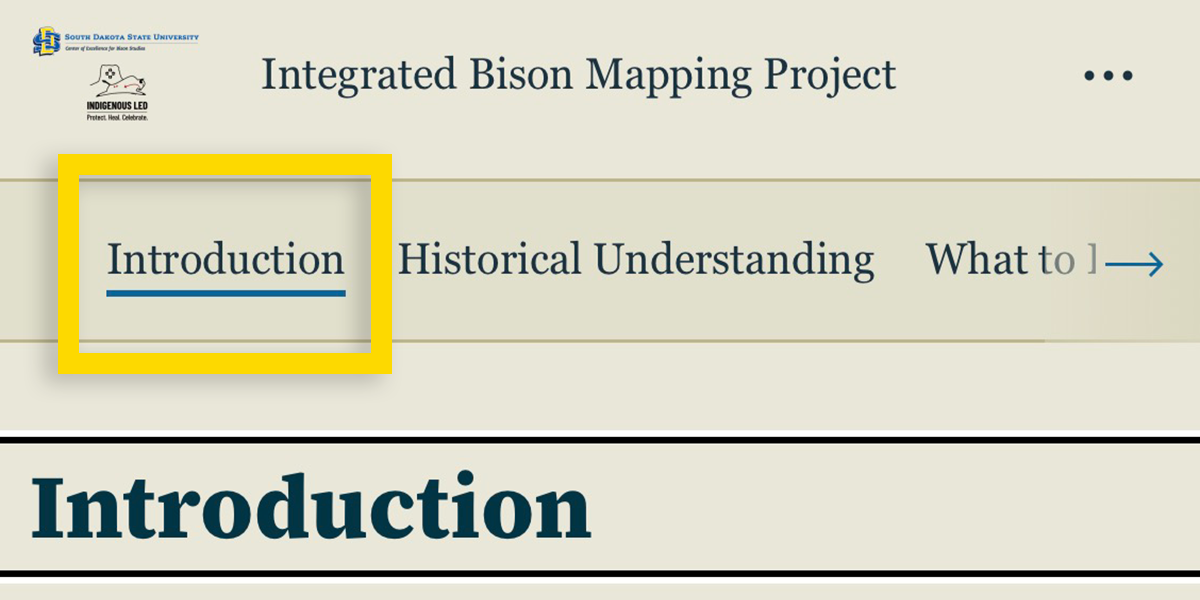
Navigating sections of the ArcGIS StoryMap can be done by clicking the section titles at the top. The navigation bar allows viewers to quickly access different sections, including Introduction, Historical Understanding, What to Expect Next, Regional Climatic Shifts, Understanding Your Region, Discussion, and Extra Resources. This makes it easier to navigate between sections without excessive scrolling. The Navigation Bar remains visible as you move through the StoryMap, providing consistent, easy access to each section.
Buttons
As you scroll through the Introduction section of StoryMap, you will encounter two buttons embedded within the page. These buttons provide direct links to the South Dakota State University Center of Excellence for Bison Studies website and to the INDIGENOUS LED website.
The links allow viewers to learn more about the organizations involved in the project, explore their missions and initiatives, and view the current work related to bison conservation, management, and stewardship.
Interacting with Map Layers
Each map layer presents a different variable relevant to bison conservation and management. Depending on the section of the StoryMap, you can explore historical conditions, projected changes in temperature and precipitation, and other environmental factors that may influence future bison distribution and management decisions.
The accompanying narrative serves as a docent to help interpret each map layer by explaining what it represents and why it is important. For additional information, please expand the map and select individual layers. A legend will appear, providing details about the selected layer, including the data being displayed and how it should be interpreted.
Expanding Maps and Selecting Layers
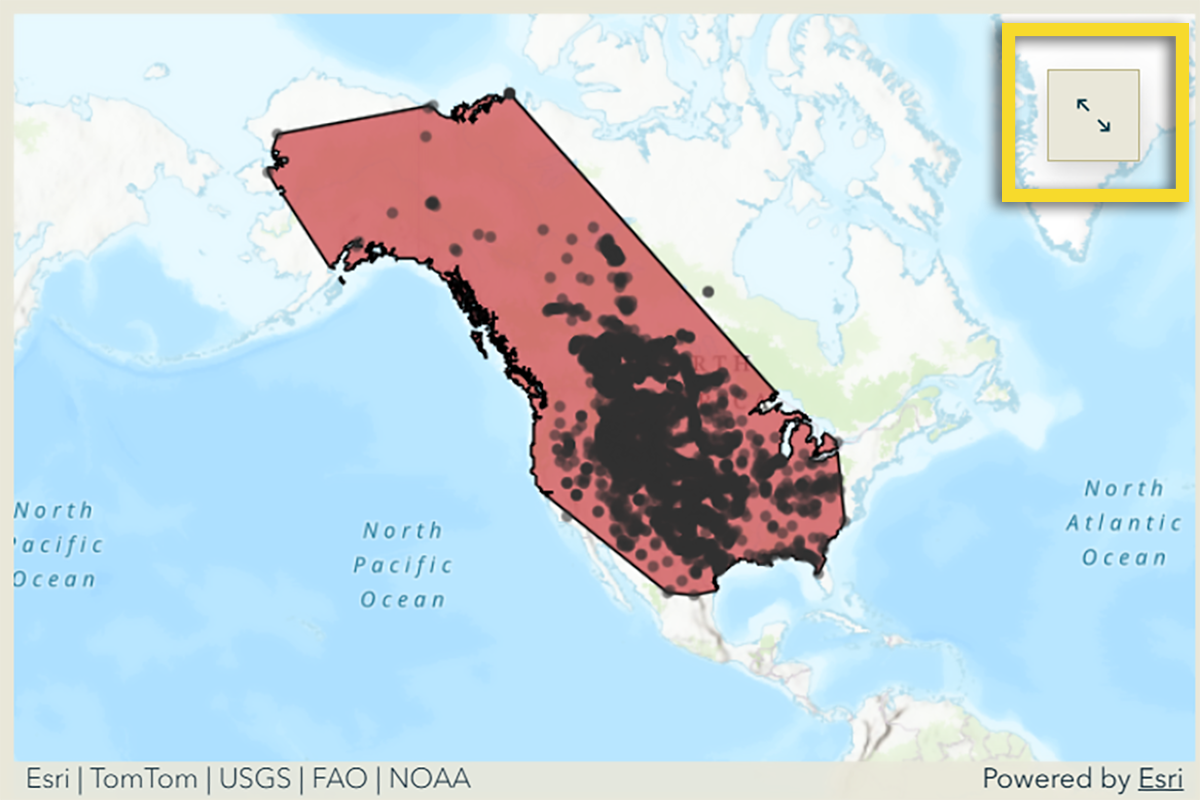
Some maps can be maximized to full screen using the Maximize Button, which features two arrows pointing away from each other and is located in the upper-right corner of the map (highlighted above).
Once a map is opened and maximized, you may click on any layer or element for more information.
Exploring Map Elements
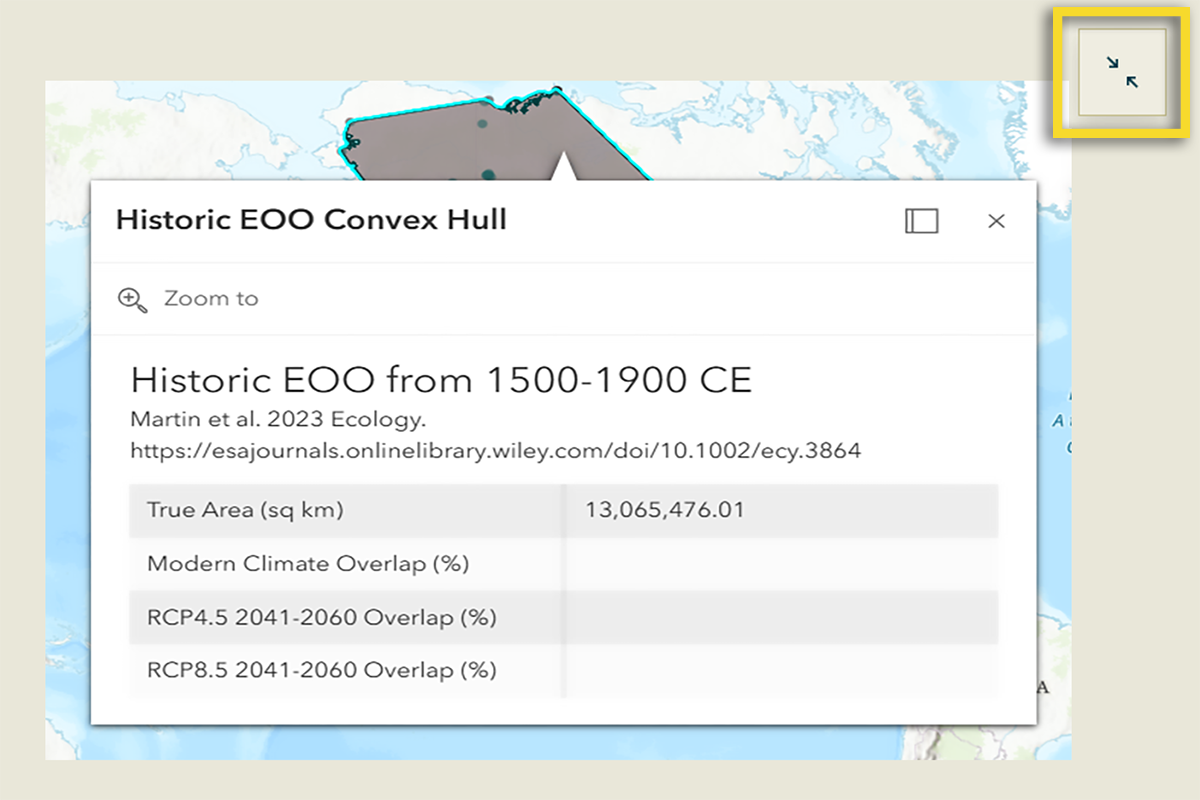
Once any of the maps are maximized, you can zoom in or zoom out and move around using your mouse. Clicking directly on any element should then open more information, similar to what is shown above (Historic EOO Convex Hull). Then, you can reduce the size of that map back to the StoryMap by clicking the Minimize Button, which has two arrows pointing toward each other (highlighted above).
Swipe
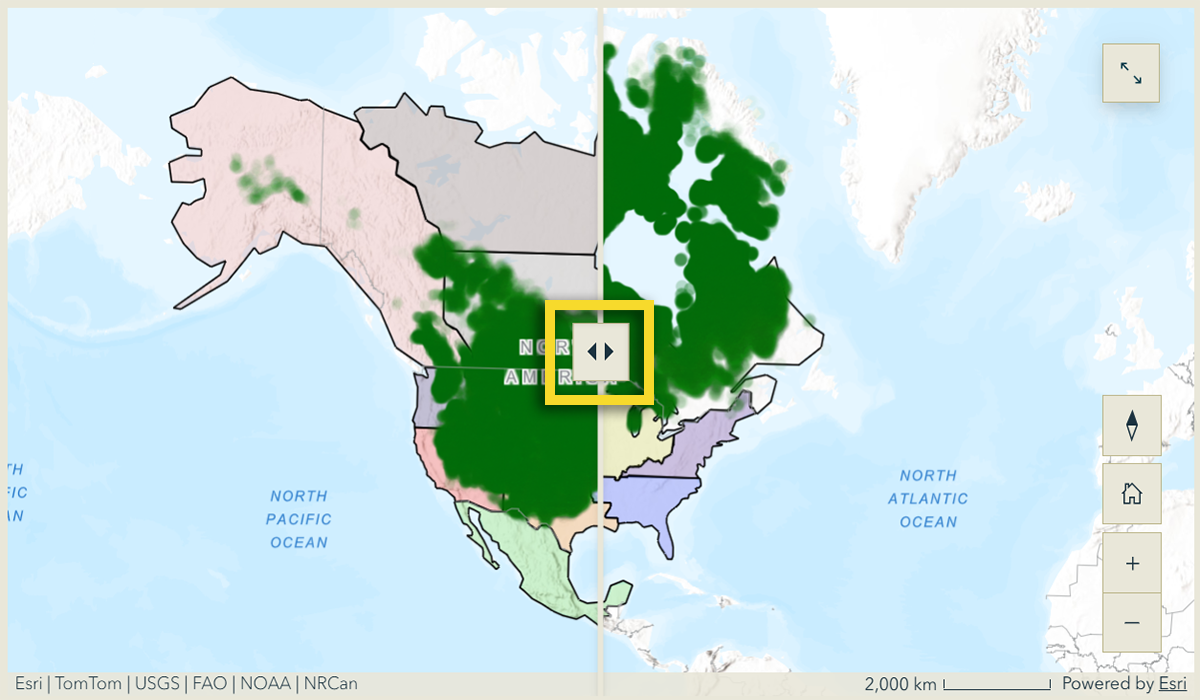
In the What to Expect Next section, viewers will encounter a Swipe action that allows you to move a slider to compare side-by-side maps that show bison climate suitability now and in the year 2100.
To use this feature, the viewer should place the mouse cursor over the Swipe Arrows (highlighted above), click and hold the mouse button, and move the cursor from side to side. You can then interactively compare the two maps and observe differences between the displayed layers. Feel free to zoom in to an area of interest.
Map Tour
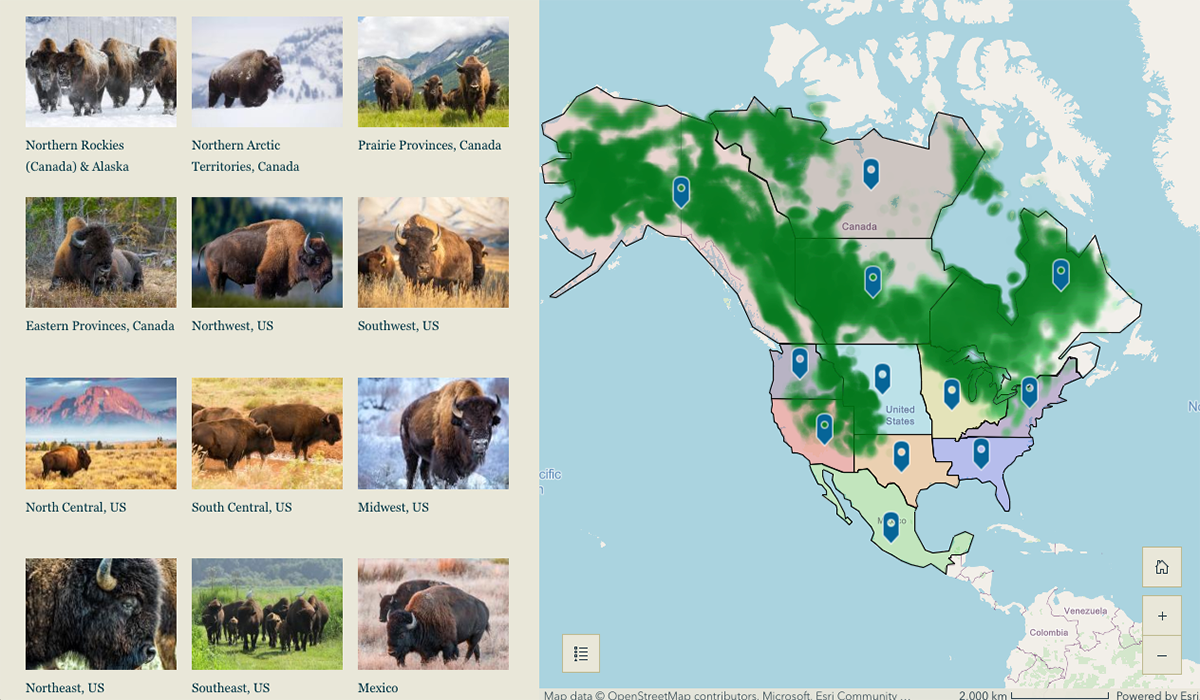
You can explore the potential impacts of climate variability within your own region of North America using the Map Tour feature. We have combined states and provinces into regions that correspond with the bison climate suitability maps. You may review the information tailored to your location there. A list of regional labels is displayed to the left of the map. You can either select your region from the list or click the corresponding location marker/pin on the map to learn more about projected climate conditions and their potential implications for bison within your region of interest.
Extra Resources
Additional resources and works cited may be found at the bottom of the StoryMap, where you can find an Extra Resources section containing links to additional articles, websites, and videos related to the IBMP. This section provides viewers with the opportunity to continue building their knowledge of climate change, bison conservation, and future management strategies.
Interpreting Results

The climate projections presented in this StoryMap represent projected future climate conditions based on climate futures scenarios and models from IPCC. These maps provide scenarios that can help viewers consider how thermal variation, extreme heat, and winter moisture conditions may change over time—these three variables are the largest drivers explaining ancient bison distributions. Because future conditions are uncertain, the maps are intended to support planning and preparedness rather than predict specific outcomes for individual locations. For example, vegetation productivity, forage quality, water access, land jurisdiction, fencing barriers, and other factors may need to be considered. Users are encouraged to consider the climate projections alongside local knowledge, community priorities, and site-specific management information when making decisions about bison conservation and stewardship.
Using This Information for Planning
The information presented in the IBMP provides a starting point for conversations about climate adaptation and long-term bison stewardship. Viewers may use the StoryMap to identify impending regional climatic variation. Within and between regions, viewers may consider potential changes in water and forage availability, evaluate infrastructure needs, and anticipate potential disease and parasite issues. Insights into these issues encourage discussion around the development of strategies to maintain healthy and resilient bison herds.
Acknowledgements
We thank the support of this project by the Center of Excellence for Bison Studies and INDIGENOUS LED.